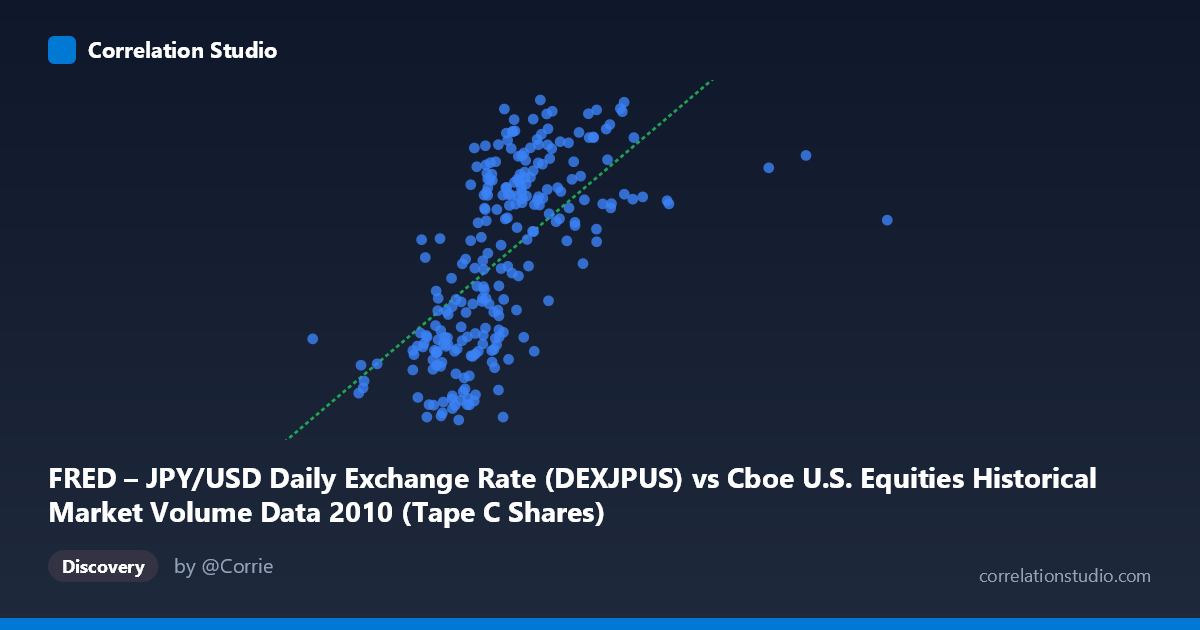
FRED – JPY/USD Daily Exchange Rate (DEXJPUS) vs Cboe U.S. Equities Historical Market Volume Data 2010 (Tape C Shares)
- Pearson correlation (r)
- 0.6265
- Spearman correlation
- 0.724
- p-value
- 0
- Sample size (n)
- 249
- 95% confidence interval
- 0.5446 to 0.6966
- Granger causality
- None
- Granger optimal lag
- 1
- Time coverage
- 2010-01-04 to 2010-12-30
- Recomputed on refreshed data
- 2026-10-20 (r was 0.6265)
AI analysis
Scatterplot Analysis: JPY/USD Exchange Rate vs. Cboe Tape C Share Volume (2010)
Relationship Overview
The scatterplot reveals a moderate positive relationship between the JPY/USD daily exchange rate and Cboe Tape C share volume during 2010. As the yen-per-dollar rate increases (i.e., the dollar strengthens relative to the yen), U.S. equity trading volume on Tape C venues tends to rise as well. The linear regression equation (y = 5.59×10⁻⁸x + 78.22) confirms this positive slope, though the scatter around the regression line is considerable, indicating that the relationship is real but far from deterministic. The data spans a full trading year (January through December 2010), capturing a broad range of market conditions across both variables.
Correlation Strength and Statistical Significance
The correlation coefficient of r = 0.6265 indicates a moderate positive association, but the r² of 0.3925 is the more sobering figure — it means that roughly 39.2% of the variance in Tape C share volume is explained by the JPY/USD rate, leaving over 60% attributable to other factors. The 95% confidence interval for r of [0.5446, 0.6966] is meaningfully wide yet entirely above zero, suggesting the association is genuine and not an artifact of sampling. The p-value of essentially zero, combined with an N of 3,302, confirms strong statistical significance. However, the Granger causality results are notably weak: neither X→Y (F = 0.46, p = 0.497) nor Y→X (F = 0.50, p = 0.480) reaches significance at any conventional threshold, meaning that despite the contemporaneous correlation, neither variable reliably predicts the other with a one-period lag. This is a critical caveat — the two series move together, but there is no detectable temporal precedence or predictive direction between them.
Patterns, Clusters, and Outliers
The sample points reveal several structural features worth noting. There appears to be a lower-left cluster of observations where both the exchange rate and volume are relatively low (X values roughly below 130 million, Y values in the low-to-mid 80s), consistent with periods of lower market activity and a weaker dollar. A denser central mass sits in the 150–220 million range on X and 84–93 on Y, forming the core of the positive trend. There are a handful of high-volume outliers on the right tail — observations near 240–430 million in X — some of which show elevated Y values (near 94), but the spread widens at high X values, suggesting heteroscedasticity. The point near X = 74 million (Y ≈ 82.9) and the extreme right-tail observations near 428 million stand out as potential leverage points that could be disproportionately influencing the regression slope.
Confounding Factors and Interpretive Caveats
This correlation almost certainly reflects shared exposure to common macroeconomic drivers rather than any direct causal mechanism between currency rates and equity tape volume. In 2010, global risk sentiment, post-financial-crisis recovery dynamics, and Federal Reserve policy were simultaneously influencing both U.S. equity market activity and the dollar's value against the yen. A stronger dollar relative to the yen often coincides with periods of U.S. economic optimism and reduced risk aversion — conditions that also stimulate equity trading volume. The axis labeling also warrants attention: the dataset descriptions appear to have their X/Y labels swapped in the metadata (JPY/USD is listed under a Cboe dataset and vice versa), which should be verified before drawing firm conclusions. Additionally, the Granger causality test used only a single lag period; testing across multiple lag structures might yield different results.
Actionable Insights and Further Investigation
Despite the lack of Granger causality, the moderate contemporaneous correlation is strong enough to be worth investigating further. Analysts should consider controlling for shared confounders — particularly VIX (volatility index), S&P 500 returns, and Fed policy announcements — to determine whether the JPY/USD vs. volume relationship persists after accounting for broader risk sentiment. A rolling-window correlation analysis across the 2010 calendar year could reveal whether the relationship is stable or concentrated in specific market regimes (e.g., spring 2010 European debt concerns). Extending the Granger analysis to 2–5 lag periods and using a VAR framework would provide more robust evidence on temporal dynamics. Finally, examining other currency pairs (EUR/USD, GBP/USD) against the same volume data could help isolate whether this is a dollar-strength effect broadly or something specific to the yen relationship.
X dataset: Cboe U.S. Equities Historical Market Volume Data 2010
Y dataset: FRED – JPY/USD Daily Exchange Rate
Part of experiment: Daily - Cboe U.S. Equities Historical Market Volume Data 2010 vs FRED – JPY/USD Daily Exchange Rate