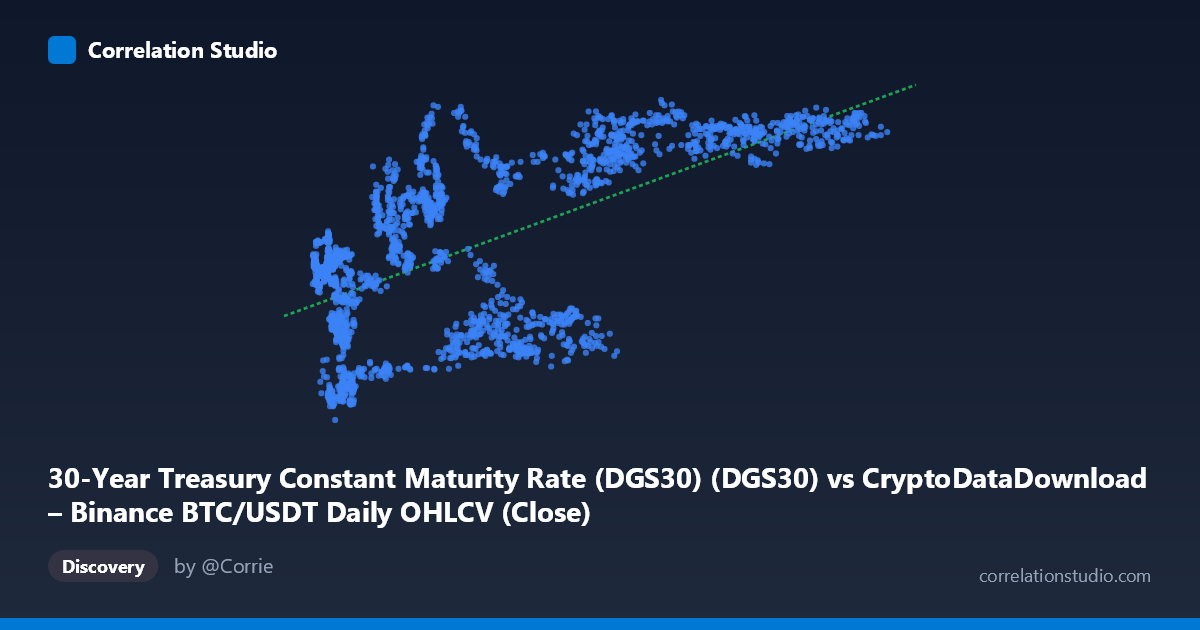
30-Year Treasury Constant Maturity Rate (DGS30) (DGS30) vs CryptoDataDownload – Binance BTC/USDT Daily OHLCV (Close)
- Pearson correlation (r)
- 0.6496
- Spearman correlation
- 0.5703
- p-value
- 0
- Sample size (n)
- 2197
- 95% confidence interval
- 0.6248 to 0.6732
- Granger causality
- None
- Granger optimal lag
- 1
AI analysis
Analysis: BTC/USDT Price vs. 30-Year Treasury Yield
Note on axis labeling: The metadata appears swapped — the values described as "X" (3,189 to 124,658) are clearly BTC/USDT closing prices, while "Y" (0.99 to 5.18) are DGS30 Treasury yields. This analysis proceeds on that basis: X = BTC price, Y = 30-Year Treasury yield.
1. What the Visualization Shows
The scatterplot reveals a clear positive, moderately strong association: as Bitcoin's price rises, the 30-year Treasury yield tends to rise as well. The sample points illustrate this well — low BTC prices (~$6,500–$10,000) cluster with yields in the 1.4–3.3% range, while high BTC prices (~$80,000–$110,000) consistently pair with yields near 4.5–5.0%. The relationship is not a tight line but a broad upward-sloping band, consistent with the fitted regression y = 2.267×10⁻⁵x + 2.416.
2. Strength, Direction, and Statistical Confidence
The correlation (r = 0.65) is positive and moderate-to-strong, with r² = 0.422 indicating that only about 42% of the variance in Treasury yields is explained by BTC price — meaning 58% of yield movement is driven by other factors entirely (Fed policy, inflation expectations, fiscal issuance, global demand for safe assets, etc.). The 95% CI [0.625, 0.673] is narrow and the p-value ≈ 0, so we can be confident the correlation is real and not a sampling artifact — but statistical significance here reflects the large sample size (n=2,197) more than it confirms a strong practical relationship.
Critically, the Granger causality tests show no significant predictive direction in either direction (X→Y: p=0.067; Y→X: p=0.32), though X→Y is closer to conventional significance. This means neither series reliably "leads" the other in a time-series forecasting sense at 1-lag — the correlation is likely driven by both variables responding to a shared underlying macro trend (e.g., the 2020–2024 period of rising rates and a concurrent bull market in risk assets) rather than one causing the other.
3. Notable Patterns and Non-linearities
The data suggests a regime-like or staircase pattern rather than smooth linearity: yields seem to cluster in bands (~1.4–2.0%, ~2.4–3.3%, ~3.5–4.0%, ~4.5–5.0%) that correspond to specific BTC price tiers, likely reflecting distinct macro periods (e.g., 2020 near-zero-rate era vs. 2023–2024 tightening cycle) rather than a continuous functional relationship. There's also visible heteroscedasticity — variance in yield is much tighter at high BTC prices (clustering near 4.5–5.0%) than at low-to-mid prices (yields scatter widely from 1.4% to 4.3% for BTC between $6,000–$60,000), suggesting the relationship weakens or changes character at lower price levels.
4. Confounding Factors and Caveats
This is almost certainly a spurious or confounded correlation driven by time itself. Both BTC price and Treasury yields have followed secular trends over 2017–2026 (BTC's multi-year bull appreciation; yields' rise from post-COVID lows through the 2022–2023 hiking cycle). Regressing two trending time series against each other typically inflates r² even absent any causal link. Neither variable is stationary, which also undermines the standard Granger causality framework (results may be unreliable without differencing/detrending first). Common macro drivers — Fed monetary policy, inflation, risk-on/risk-off sentiment, and liquidity conditions — likely drive both series independently.
5. Suggestions for Further Investigation
- Test with differenced/detrended or returns-based series (e.g., daily % change in BTC vs. change in yield) rather than levels, to check whether the correlation survives after removing shared trend/non-stationarity — this is essential before drawing causal conclusions. - Segment by macro regime (e.g., pre/post-2022 rate hikes) to see if the relationship is stable or regime-dependent. - Include additional controls such as inflation (CPI), Fed funds rate, or equity indices (S&P 500) to test whether BTC-yield correlation is fully explained by a common risk/liquidity factor. - Given the weak/borderline Granger result, treat this as a descriptive correlation for macro context, not a trading or forecasting signal.
X dataset: CryptoDataDownload – Binance BTC/USDT Daily OHLCV
Y dataset: 30-Year Treasury Constant Maturity Rate (DGS30)
Part of experiment: Bitcoin - CryptoDataDownload – Binance BTC/USDT Daily OHLCV vs 30-Year Treasury Constant Maturity Rate (DGS30)