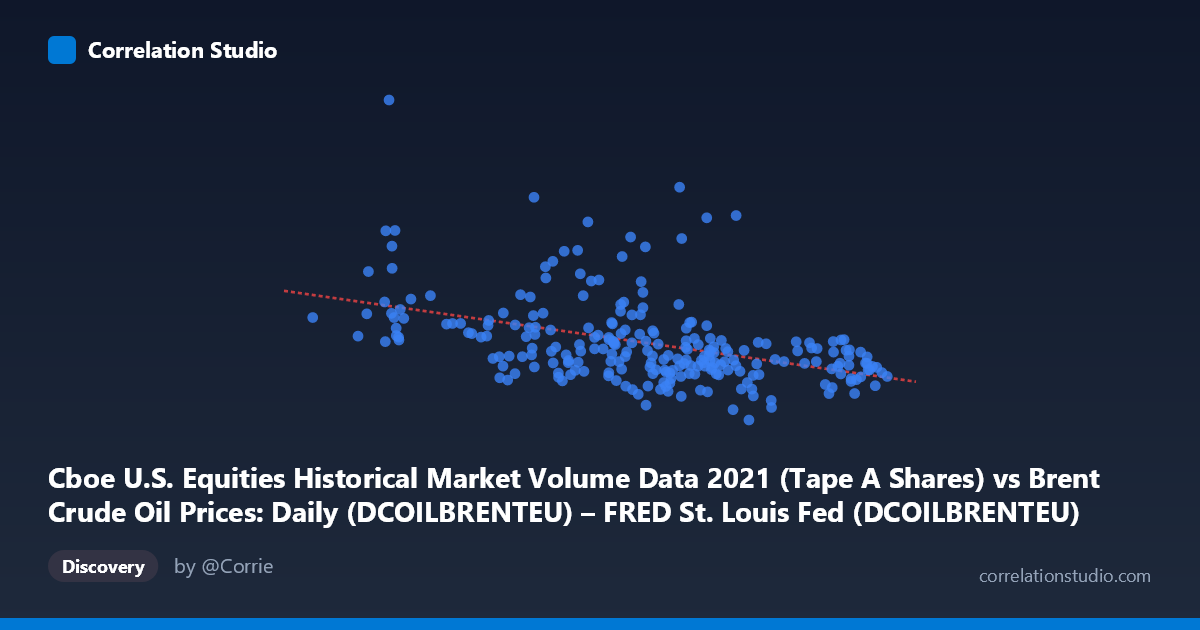
Cboe U.S. Equities Historical Market Volume Data 2021 (Tape A Shares) vs Brent Crude Oil Prices: Daily (DCOILBRENTEU) – FRED St. Louis Fed (DCOILBRENTEU)
- Pearson correlation (r)
- -0.4369
- Spearman correlation
- -0.4989
- p-value
- 0
- Sample size (n)
- 247
- 95% confidence interval
- -0.5327 to -0.3301
- Granger causality
- None
- Granger optimal lag
- 10
AI analysis
Analysis: Brent Crude Oil Price vs. U.S. Equity Market Volume (2021)
Relationship Overview
The scatterplot reveals a modest negative relationship between daily Brent crude oil prices (X-axis, in USD/barrel) and U.S. equity market trading volume (Y-axis, in shares). As crude oil prices rise, equity trading volume tends to decline, and vice versa. The linear regression equation (y = -2,803,280x + 432,244,000) quantifies this: each additional dollar per barrel in Brent crude is associated with approximately 2.8 million fewer shares traded on U.S. exchanges. However, the scatter is visibly wide throughout the plot, and no tight linear band is apparent — suggesting the relationship, while real, is far from deterministic.
Correlation Strength, Direction, and Statistical Significance
The Pearson correlation of r = -0.437 indicates a weak-to-moderate negative association. More informatively, R² = 0.191, meaning crude oil prices explain only about 19% of the variance in equity trading volume — leaving roughly 81% attributable to other factors entirely. The 95% confidence interval for r spans [-0.533, -0.330], a range that is meaningfully negative throughout, confirming directional consistency. With a p-value of 6.1 × 10⁻¹³ across n = 247 paired observations, the result is highly statistically significant and extremely unlikely to be a chance finding. Critically, however, the Granger causality tests show no significant predictive directionality in either direction (X→Y: F = 0.97, p = 0.47; Y→X: F = 1.06, p = 0.39), even at an optimal lag of 10 periods. This means that while the two variables are correlated contemporaneously, neither reliably leads or predicts the other in a temporal sense — ruling out a straightforward causal channel.
Notable Patterns, Clusters, and Outliers
Several features stand out in the sample data. There is a cluster of high-volume outliers at lower-to-mid oil price ranges (roughly 55–70 USD/barrel), including points like (55.25, 349,651,199), (66.69, 344,604,084), and (69.95, 360,582,863), which pull the regression line and inflate the negative slope. Conversely, the upper oil price range (80–86 USD/barrel) shows consistently lower trading volumes (roughly 164–237 million shares), with tighter dispersion. At lower price ranges (50–65 USD/barrel), volume variance is substantially higher, suggesting heteroscedasticity — the relationship is noisier at lower oil prices than higher ones. This non-constant variance is a notable structural feature that a simple linear model may not adequately capture.
Confounding Factors and Interpretive Caveats
Several important caveats apply. First, 2021 was an unusual year — post-COVID reopening dynamics drove both oil demand recovery and elevated retail trading activity (meme stocks, heightened retail participation), which may have created a spurious or context-specific correlation. Second, macro regime effects likely confound both variables simultaneously: risk-on environments can simultaneously depress oil prices (through dollar strength or demand uncertainty) and boost equity activity, or vice versa. Third, the axis labels in the dataset appear transposed — the X-axis is labeled as CBOE volume data but described as Brent crude price, and vice versa; analysts should verify column assignments before drawing firm conclusions. Fourth, the lack of Granger causality at lags up to 10 days strongly suggests any relationship is driven by a common third factor (e.g., macroeconomic news, risk sentiment, USD strength) rather than a direct mechanism.
Actionable Insights and Further Investigation
Given the modest explanatory power and absent Granger causality, crude oil price alone is a poor predictor of equity trading volume and should not be used in isolation for forecasting. However, the consistent negative association warrants further exploration. Recommended next steps include: (1) introducing control variables such as VIX (volatility index), USD index, and macroeconomic news event flags to test whether the correlation survives adjustment; (2) segmenting the data by market regime (e.g., trending vs. range-bound oil markets) to test whether the relationship strengthens in specific conditions; (3) applying a non-linear or quantile regression approach given the apparent heteroscedasticity; and (4) extending the analysis beyond 2021 to test whether this correlation is a durable structural feature or an artifact of pandemic-era market dynamics. A vector autoregression (VAR) model incorporating additional macro variables would be a natural next step to disentangle coincident correlation from genuine predictive signal.
X dataset: Brent Crude Oil Prices: Daily (DCOILBRENTEU) – FRED St. Louis Fed
Y dataset: Cboe U.S. Equities Historical Market Volume Data 2021
Part of experiment: Daily - Brent Crude Oil Prices: Daily (DCOILBRENTEU) – FRED St. Louis Fed vs Cboe U.S. Equities Historical Market Volume Data 2021