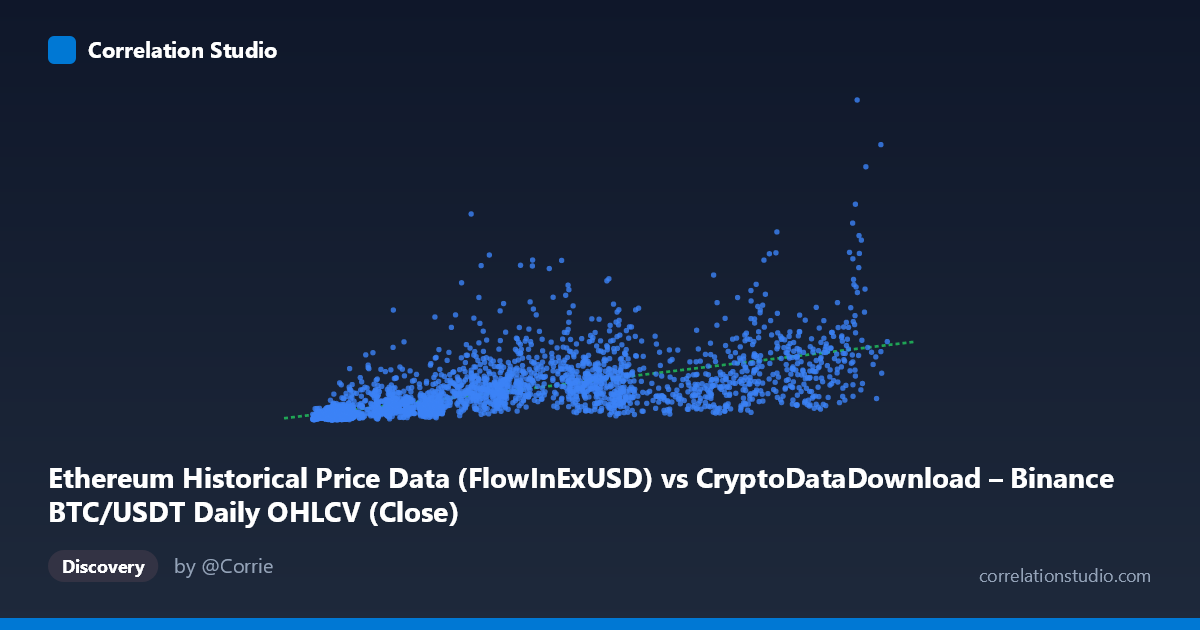
Ethereum Historical Price Data (FlowInExUSD) vs CryptoDataDownload – Binance BTC/USDT Daily OHLCV (Close)
- Pearson correlation (r)
- 0.6562
- Spearman correlation
- 0.8171
- p-value
- 0
- Sample size (n)
- 3191
- 95% confidence interval
- 0.636 to 0.6755
- Granger causality
- Y → X
- Granger optimal lag
- 10
AI analysis
Analysis: BTC/USDT Volume vs. Price Relationship
1. What the Visualization Reveals
The scatterplot displays a positive, moderately strong association between X (labeled as flow-in/exchange volume metric) and Y (BTC/USDT closing price). As X increases, Y tends to increase as well, but the relationship is far from a tight linear band — there's substantial vertical scatter at nearly every X value, particularly in the low-to-mid X range (roughly 4,000–30,000), where Y values span nearly two orders of magnitude (from ~15M to over 1.5B). This heteroscedastic fan-shaped pattern is a hallmark of financial/volume data and suggests the relationship strengthens or clarifies at higher X values while remaining noisy at lower ones.
2. Strength, Direction, and Predictive Relationship
The Pearson correlation (r = 0.656) indicates a moderate-to-strong positive linear relationship, but r² = 0.431 tells the more important story: only 43% of the variance in Y is explained by X in a linear model — meaning 57% of price variation is driven by factors outside this X variable. The 95% CI [0.636, 0.676] is tight (thanks to large N=3,191), giving high confidence that the true population correlation sits in this moderate range — this is not a statistical fluke (p≈0). However, precision about the correlation's value does not imply the relationship is strong or fully deterministic.
The Granger causality results add a critical temporal dimension: Y Granger-causes X, not the other way around (Y→X: F=2.64, p=0.0033 vs. X→Y: F=1.47, p=0.146, not significant). This means past values of Y (price) have predictive power for future values of X (volume/flow), but not vice versa. This is intuitively consistent with market microstructure — price moves often precede or coincide with shifts in trading volume/flow-in as traders react to price action, rather than volume mechanically driving price at a 10-period lag.
3. Notable Patterns and Non-linear Features
Several features stand out: - Fan/wedge shape: Variance in Y increases somewhat with X, though not uniformly — some of the highest Y values (1.5–1.8B) occur at moderate X (~35,000–65,000), not at the extreme high end. - Low-X volatility cluster: Points with X < 15,000 show Y ranging from ~15M to over 500M — this wide spread at low volume suggests other regime factors (bull/bear cycles, dates) dominate here. - Spearman ρ Pearson r (noted in the data) strongly suggests curvature — likely a logarithmic or power-law relationship rather than linear, consistent with typical price-volume dynamics in crypto markets where log-price or log-volume transformations often linearize the relationship. - No obvious extreme outliers, but the point (36445, 1.567B) and (65464, 1.529B) stand out as high-Y anomalies relative to neighboring X values, possibly corresponding to specific volatile market events (e.g., 2021 bull run or 2024 rally).
4. Confounding Factors and Caveats
Major caveats apply here: - Time-series autocorrelation: Both X and Y are daily financial series over ~9 years (2017–2026), meaning observations are not independent — standard Pearson/Spearman correlation and even Granger tests can be distorted by trends, regime shifts (bull/bear markets), and non-stationarity. This inflates apparent significance and can produce spurious correlation from shared upward drift. - Column naming ambiguity: The metadata is confusing — X is labeled "Ethereum...FlowInExUSD" but described as BTC/USDT OHLCV, while Y is labeled "BTC/USDT Close" but tied to an Ethereum dataset. This mismatch raises real questions about whether this is actually a BTC-price-vs-BTC-volume relationship, an ETH-vs-BTC cross-asset relationship, or a data-pipeline labeling error. This should be resolved before drawing conclusions. - Common driver: Both crypto price and volume/flow metrics are jointly driven by external macro factors (interest rates, regulatory news, overall market sentiment) that could create correlation without direct causality in either direction. - Non-linear model misspecification: Using linear r²/regression on a relationship that's likely log-linear or power-law understates true explanatory power.
5. Actionable Insights
1. Resolve data labeling before further analysis — confirm whether this is BTC-BTC, ETH-BTC, or a mislabeled cross-asset comparison. 2. Re-fit with log transformation: Given Spearman Pearson and the fan-shaped scatter, try log(X) vs log(Y) or log(Y) vs X regression — likely to substantially improve fit and yield a more interpretable elasticity-style relationship. 3. Test stationarity (ADF/KPSS) before trusting Granger causality results; consider differencing or detrending both series to rule out spurious causality from shared trends. 4. Segment by market regime (bull/bear/sideways) to check if the X-Y relationship is regime-dependent, which would explain the heteroscedastic scatter. 5. Given Y Granger-causes X, consider building a predictive model for X (volume/flow) using lagged Y (price) — this is the direction with actual predictive signal, useful for volume-forecasting or liquidity-modeling applications rather than price prediction from volume.
X dataset: CryptoDataDownload – Binance BTC/USDT Daily OHLCV
Y dataset: Ethereum Historical Price Data
Part of experiment: Bitcoin - CryptoDataDownload – Binance BTC/USDT Daily OHLCV vs Ethereum Historical Price Data