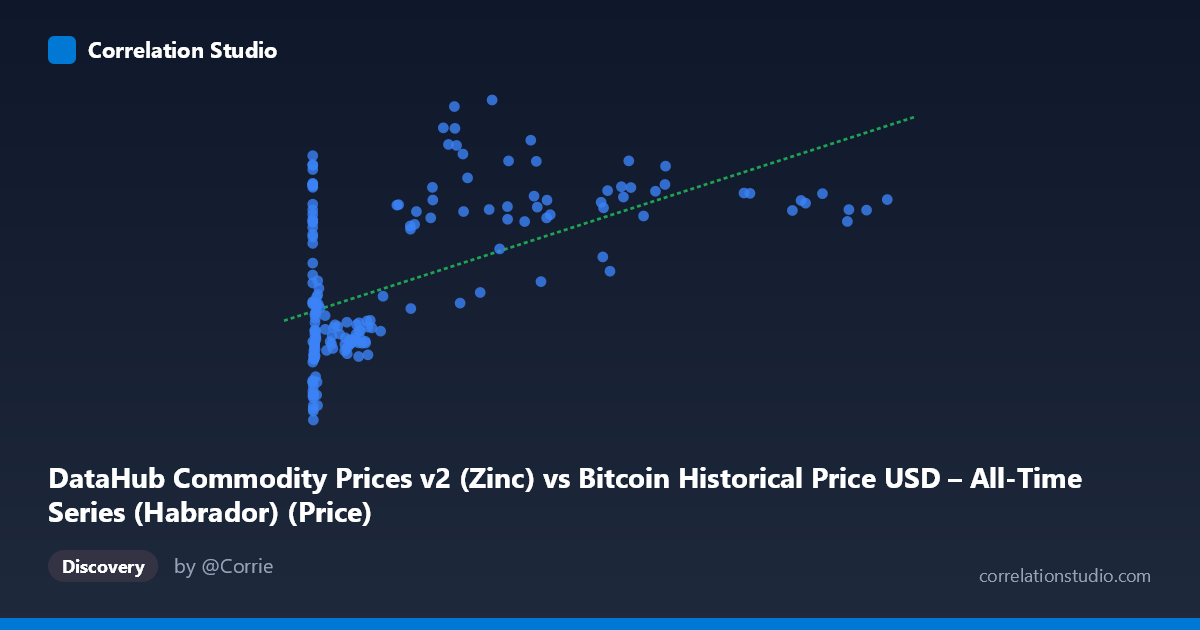
DataHub Commodity Prices v2 (Zinc) vs Bitcoin Historical Price USD – All-Time Series (Habrador) (Price)
- Pearson correlation (r)
- 0.5703
- Spearman correlation
- 0.4329
- p-value
- 0
- Sample size (n)
- 182
- 95% confidence interval
- 0.4633 to 0.661
- Granger causality
- None
- Granger optimal lag
- 1
AI analysis
Analysis: Bitcoin Price vs. Zinc Commodity Price
1. What the Visualization Reveals
The scatterplot shows a moderate positive relationship between Bitcoin's USD price (X-axis) and zinc commodity prices (Y-axis) across 182 paired monthly observations spanning 2010–2025. At low Bitcoin prices (under ~$1,000), zinc prices cluster tightly in the low-to-mid 20s range with relatively little variance. As Bitcoin prices climb into the tens of thousands, zinc prices become both higher on average and considerably more scattered, ranging from the low 30s to mid-40s. This pattern suggests the relationship is not uniform across the full range of X — it behaves more like a threshold effect than a smooth linear trend.
2. Strength, Direction, and Statistical Confidence
The correlation coefficient (r = 0.57) indicates a moderate positive linear relationship, with an R² of 0.325 — meaning only about 33% of the variance in zinc prices is statistically explained by Bitcoin's price level, leaving roughly two-thirds unexplained. The 95% confidence interval [0.463, 0.661] is reasonably tight and excludes zero, and the p-value of ~0 confirms this correlation is statistically significant and not due to random chance, even accounting for the reduced sample size (n=182 vs. population 429, likely due to date alignment). However, statistical significance should not be conflated with strong predictive power — a third of shared variance leaves substantial room for divergence. Critically, the Granger causality tests show no significant predictive direction in either direction (X→Y: p=0.73; Y→X: p=0.57). This means neither series' past values help forecast the other's future values — the correlation is contemporaneous/structural rather than causal or lead-lag in nature.
3. Notable Patterns and Outliers
Several features stand out: (1) A dense cluster of low-X, low-Y points (Bitcoin under $1,000, zinc ~20-28) representing the 2010-2013 era, showing tight, low-variance behavior. (2) A fan-shaped widening of variance as X increases — at Bitcoin prices around $20,000-$45,000, zinc prices range dramatically from ~29 to ~44, suggesting other factors dominate zinc pricing in this regime. (3) Notable outliers include points like (33087, 29.62) and (45092, 30.48), where zinc stayed low despite high Bitcoin prices, breaking the general upward trend — likely corresponding to zinc-specific supply/demand shocks decoupled from crypto markets. (4) A near-flat cluster around Bitcoin's very low historical values (X < 50) with wildly varying zinc prices (20-36), indicating no relationship in Bitcoin's earliest, pre-adoption era.
4. Confounding Factors and Caveats
This correlation is almost certainly spurious or indirect, driven by a shared confound: both series have trended upward over the 2010-2025 period due to broad macroeconomic forces — inflation, global liquidity expansion, post-2020 monetary stimulus, and general commodity/asset bull markets — rather than any direct economic link between cryptocurrency speculation and zinc mining/demand fundamentals. Since both are non-stationary time series with long-term upward drift, naive correlation on levels (rather than returns or detrended values) tends to inflate apparent relationships. The lack of Granger causality strongly supports this interpretation: there's no mechanistic pathway where Bitcoin prices inform zinc markets or vice versa. Additionally, the "monthly" resampling of Bitcoin's highly volatile daily price data likely smooths out crypto-specific dynamics, potentially exaggerating alignment with slower-moving commodity trends.
5. Actionable Insights and Further Investigation
Given the absence of Granger causality and the likely confound of shared macro trends, this correlation should not be used for trading or forecasting purposes — treating Bitcoin price as a predictive signal for zinc (or vice versa) is not supported by the data. To properly investigate whether a genuine relationship exists, analysts should: (a) re-run the analysis on differenced or log-return series rather than price levels to remove trend-driven spurious correlation; (b) include a common macro variable (e.g., USD index, global M2 money supply, or CPI) as a control to test if the Bitcoin-zinc relationship disappears once shared drivers are accounted for; (c) examine sub-period stability (e.g., pre/post-2020) to see if the relationship is an artifact of a specific era rather than a persistent structural feature. Absent such tests, this should be treated as a coincidental co-trending pattern rather than evidence of economic linkage.
X dataset: Bitcoin Historical Price USD – All-Time Series (Habrador)
Y dataset: DataHub Commodity Prices v2
Part of experiment: Bitcoin - Bitcoin Historical Price USD – All-Time Series (Habrador) vs DataHub Commodity Prices v2