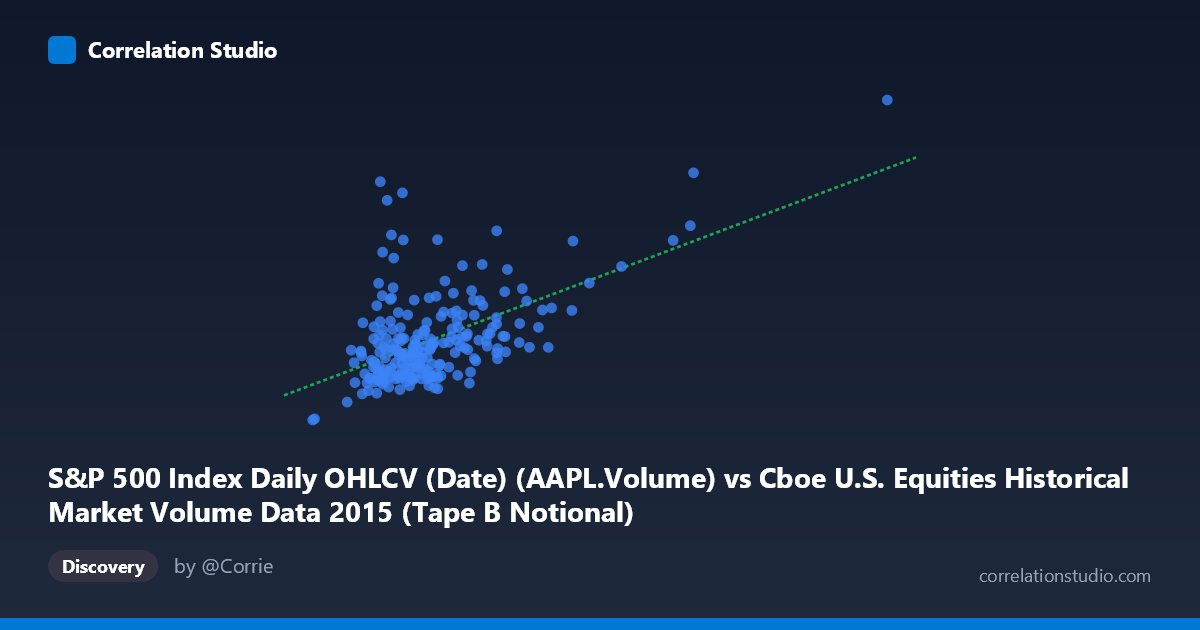
S&P 500 Index Daily OHLCV (Date) (AAPL.Volume) vs Cboe U.S. Equities Historical Market Volume Data 2015 (Tape B Notional)
- Pearson correlation (r)
- 0.5536
- Spearman correlation
- 0.4077
- p-value
- 0
- Sample size (n)
- 222
- 95% confidence interval
- 0.4551 to 0.6387
- Granger causality
- None
- Granger optimal lag
- 10
AI analysis
Scatterplot Analysis: AAPL Trading Volume vs. Cboe Tape B Notional Value (2015)
Relationship Overview The scatterplot reveals a moderate positive relationship between Apple's (AAPL) daily trading volume on the S&P 500 and Cboe's Tape B Notional trading value across U.S. equity exchanges in 2015. As AAPL volume increases, Tape B Notional value tends to rise as well, consistent with the idea that heightened activity in a high-profile stock like AAPL often accompanies broader market engagement. However, the scatter around the regression line (y = 0.00639x + 15,938,500) is considerable, indicating that this relationship, while real, is far from deterministic. The bulk of observations cluster in the lower-left region of the chart, suggesting that most trading days involve moderate AAPL volume and moderate Tape B activity, with elevated readings being relatively uncommon.
Correlation Strength and Statistical Interpretation The Pearson correlation of r = 0.5536 reflects a moderate positive association, but the explanatory power is more soberly captured by r² = 0.3065 — meaning only 30.6% of the variance in Tape B Notional is explained by AAPL volume. The remaining ~70% is driven by factors entirely outside this model. The 95% confidence interval of [0.4551, 0.6387] is reasonably tight and does not approach zero, lending credibility to the correlation's existence across the population. The p-value of effectively zero confirms the result is highly statistically significant given n = 222 paired observations from a population of 506 trading days. Critically, however, the Granger causality tests fail in both directions (X→Y: F = 0.676, p = 0.746; Y→X: F = 0.744, p = 0.683), meaning neither variable temporally predicts the other at the optimal 10-period lag. This is an important qualifier: the correlation reflects contemporaneous co-movement, not a leading or lagging predictive relationship suitable for forecasting.
Notable Patterns, Clusters, and Outliers The data exhibits a pronounced lower-left clustering — the majority of observations fall below ~6 billion AAPL shares and ~80 million in Tape B Notional — with a long right tail of high-volume, high-notional outliers. Two points stand out dramatically: the observation at approximately (17.9B, 162.2M) is a clear extreme outlier, sitting far beyond the main cloud and likely corresponding to a major market event or volatility episode in 2015 (plausibly the August flash crash). A secondary outlier near (12.5B, 103.6M) and another at (3.98B, 124.1M) also deviate from the trend — the latter notably showing high Tape B Notional despite relatively ordinary AAPL volume, suggesting Tape B activity can spike independently. These outliers likely exert disproportionate leverage on the regression slope and correlation coefficient.
Confounding Factors and Caveats Several confounds complicate causal interpretation. First, both variables are likely driven by common macro factors — market volatility (VIX spikes), earnings announcements, Federal Reserve communications, and geopolitical events in 2015 would simultaneously elevate AAPL volume and broad market notional activity, creating spurious correlation. Second, the dataset mismatch in labeling (AAPL volume from one dataset cross-referenced against Tape B Notional from an S&P 500 OHLCV dataset) warrants scrutiny about alignment and whether the pairing is methodologically appropriate. Third, temporal autocorrelation is likely present in both series — high-volume days cluster together — which can inflate the apparent correlation and violate standard regression assumptions. The failed Granger tests also suggest the relationship may be entirely contemporaneous and driven by shared latent variables rather than any meaningful structural link.
Actionable Insights and Further Investigation Given the moderate correlation and the absence of Granger causality, practitioners should not use AAPL volume as a standalone predictor of Tape B Notional for trading or risk models. However, the co-movement does suggest that AAPL can serve as a useful sentiment proxy — when AAPL volume spikes dramatically, it signals broad market stress worth monitoring. Recommended next steps include: (1) controlling for the VIX or realized volatility to test whether the correlation persists after accounting for market-wide fear; (2) removing or separately modeling the extreme outliers (particularly the August 2015 event) to obtain a cleaner baseline relationship; (3) testing other high-capitalization stocks (MSFT, GOOG) to determine whether AAPL is uniquely predictive or simply one of many correlated market indicators; and (4) exploring non-linear models or regime-switching frameworks given the apparent heteroscedasticity and clustering visible in the scatterplot.
X dataset: Cboe U.S. Equities Historical Market Volume Data 2015
Y dataset: S&P 500 Index Daily OHLCV (Date)
Part of experiment: Daily - Cboe U.S. Equities Historical Market Volume Data 2015 vs S&P 500 Index Daily OHLCV (Date)