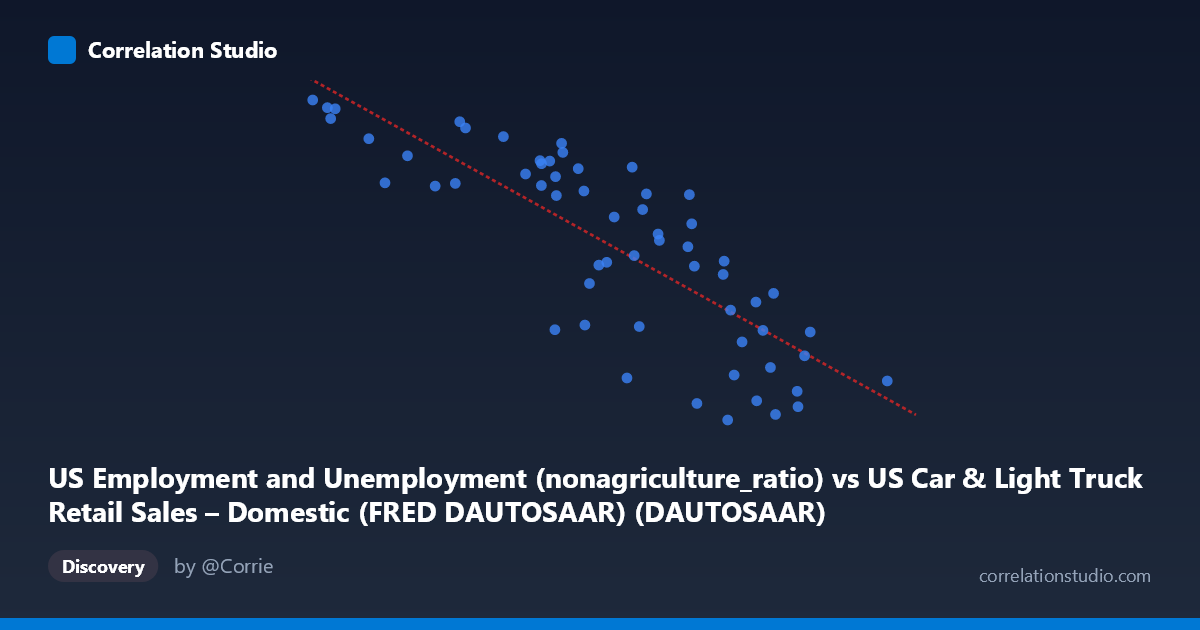
US Employment and Unemployment (nonagriculture_ratio) vs US Car & Light Truck Retail Sales – Domestic (FRED DAUTOSAAR) (DAUTOSAAR)
- Pearson correlation (r)
- -0.8172
- Spearman correlation
- -0.8556
- p-value
- 0
- Sample size (n)
- 59
- 95% confidence interval
- -0.8875 to -0.7096
- Granger causality
- None
- Granger optimal lag
- 10
- Time coverage
- 1967-01-01 to 2025-01-01
- Recomputed on refreshed data
- 2026-10-20 (r was -0.8172)
AI analysis
Scatterplot Analysis: Non-Agricultural Employment Ratio vs. Domestic Auto Retail Sales
Relationship Overview
The scatterplot reveals a clear negative linear relationship between the US non-agricultural employment ratio (X) and domestic auto retail sales measured in seasonally adjusted annual rate (Y). As the employment ratio increases, domestic auto sales decline — a counterintuitive finding at first glance, given that employment is typically associated with consumer purchasing power and demand. The linear regression equation (y = −10,920.4x + 187,206) confirms this inverse slope, with the data points clustering reasonably tightly around the regression line across the observed range of approximately 1.86 to 10.14 on the X-axis and 70,527 to 161,268 units on the Y-axis.
Correlation Strength and Statistical Significance
The Pearson correlation of r = −0.817 indicates a strong negative association, and the R² of 0.668 means that roughly 66.8% of the variance in domestic auto sales is explained by the non-agricultural employment ratio — a substantial proportion for macroeconomic data spanning nearly six decades. The 95% confidence interval of [−0.888, −0.710] is entirely negative and relatively narrow, reinforcing high confidence that the true population correlation is meaningfully negative. The p-value of 2.887×10⁻¹⁵ is vanishingly small, decisively rejecting the null hypothesis of no correlation. However, the Granger causality tests complicate the causal narrative: neither X→Y (F = 0.981, p = 0.481) nor Y→X (F = 1.714, p = 0.127) achieves statistical significance at conventional thresholds, even at the optimal lag of 10 periods. This means that while the two variables are strongly correlated contemporaneously, neither demonstrably predicts the other temporally, cautioning strongly against causal interpretation.
Notable Patterns, Clusters, and Outliers
Several structural features are visible in the data. Points in the lower X range (roughly 1.86–3.5) cluster at high Y values (150,000–161,000+), representing a distinct high-sales regime, with the point (1.86, 161,268) acting as an apparent upper-boundary anchor. At the upper X range (8.5–10.14), sales compress toward 70,000–95,000, with (10.14, 81,594) and (7.84, 70,527) as the lowest observed values. There is notable vertical scatter in the mid-range (X ≈ 5–7), where Y values span roughly 80,000 to 150,000 — suggesting that the relationship is less predictive in moderate employment-ratio conditions. A few points, such as (7.39, 75,215) and (6.61, 130,207) sitting in close X proximity but with ~55,000 unit Y difference, hint at potential non-linear or regime-dependent dynamics not fully captured by the linear model.
Confounding Factors and Interpretive Caveats
The apparent paradox of rising employment correlating with falling auto sales is almost certainly a temporal artifact rather than a true causal mechanism. The dataset spans 1967–2025, a period during which domestic auto sales have faced profound structural disruptions: the rise of foreign/import competition (which would reduce domestic-specific sales while employment remained stable or grew), fuel crises, credit cycles, the 2008–2009 financial crisis, COVID-19 supply chain shocks, and long-run shifts in consumer preferences toward SUVs and trucks not fully captured in this "domestic car" metric. The X variable — non-agricultural employment ratio — likely serves as a proxy for broader economic era rather than a direct demand driver. Omitted variables such as real interest rates, consumer credit availability, fuel prices, import market share, and demographic shifts almost certainly account for a significant portion of the unexplained 33.2% variance and may mediate the observed relationship entirely.
Actionable Insights and Further Investigation
Given the strong correlation but absent Granger causality, the most productive next step would be to decompose the time series into distinct economic regimes (pre-1980 domestic dominance, 1980s–2000s import competition growth, post-2008 recovery, COVID era) to test whether the negative correlation holds within subperiods or is primarily driven by long-run secular trends — a classic spurious correlation scenario. Analysts should incorporate import-adjusted total auto sales alongside domestic-only figures to isolate whether the employment-sales relationship changes. Adding consumer sentiment indices, real auto loan rates, and oil price data as covariates in a multivariate regression would clarify how much independent predictive power the employment ratio retains. Finally, repeating the Granger causality test at shorter lags (1–4 periods) and across subperiods would determine whether any temporal predictive signal exists within specific economic cycles, even if absent in the full 58-year sample.
X dataset: US Car & Light Truck Retail Sales – Domestic (FRED DAUTOSAAR)
Y dataset: US Employment and Unemployment
Part of experiment: Yearly - US Car & Light Truck Retail Sales – Domestic (FRED DAUTOSAAR) vs US Employment and Unemployment