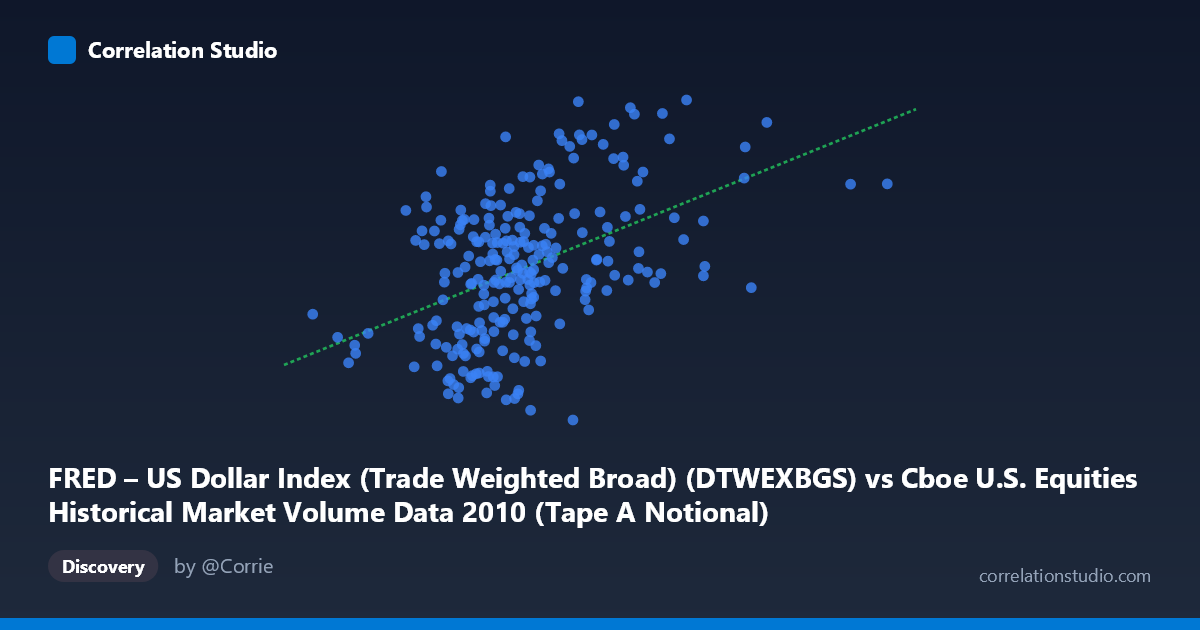
FRED – US Dollar Index (Trade Weighted Broad) (DTWEXBGS) vs Cboe U.S. Equities Historical Market Volume Data 2010 (Tape A Notional)
- Pearson correlation (r)
- 0.4574
- Spearman correlation
- 0.4248
- p-value
- 0
- Sample size (n)
- 245
- 95% confidence interval
- 0.3522 to 0.5511
- Granger causality
- Y → X
- Granger optimal lag
- 1
AI analysis
Analysis: US Dollar Index vs. Cboe Equity Market Notional Volume (2010)
Relationship Overview The scatterplot reveals a modest positive relationship between the Trade Weighted US Dollar Index (X-axis) and Cboe Tape A Notional trading volume (Y-axis) across 245 daily observations in 2010. The linear regression equation (y = 3.596E-10x + 89.77) indicates that as equity market notional volume increases, the dollar index tends to be higher. While the upward trend is discernible, the scatter around the regression line is considerable, suggesting the relationship is real but far from deterministic. The data cloud shows meaningful dispersion across the full range of both variables, with no tight clustering along the regression line.
Correlation Strength and Statistical Significance The Pearson correlation of r = 0.457 reflects a moderate positive association, but the more informative metric is r² = 0.209 — meaning only ~21% of the variance in the Dollar Index is explained by equity notional volume. The remaining ~79% is attributable to other factors entirely. The 95% confidence interval [0.352, 0.551] is reasonably narrow given n = 245, and the p-value of 4.55E-14 confirms the correlation is highly unlikely to be a sampling artifact. Critically, the Granger causality results invert the intuitive direction: Y (Dollar Index) Granger-causes X (notional volume) at a 1-period lag (F = 4.28, p = 0.040), while the reverse direction fails to reach significance (F = 0.199, p = 0.656). This suggests that dollar strength temporally precedes changes in equity market activity — not the other way around — which has meaningful implications for how one might use these variables in a predictive framework.
Notable Patterns and Outliers Several features stand out in the data distribution. There is a visible concentration of points in the 7–11 billion volume range paired with Dollar Index values between 90–95, representing the most typical daily trading conditions of 2010. A handful of high-volume outliers (above ~14–18 billion notional) appear scattered at various dollar index levels, suggesting episodic spikes in trading activity that don't consistently align with dollar strength. The point near (18.97B, 95.3) is particularly notable as the highest-volume observation yet falls mid-range on the dollar index. There also appear to be low-volume days clustered around 3.5–6.5 billion that span a surprisingly wide range of dollar index values (89–92), hinting at non-linearity or regime differences at the lower end of market activity.
Confounding Factors and Caveats Several important caveats temper interpretation. First, 2010 was a distinctive macroeconomic period — the post-financial crisis recovery with active Fed intervention, European sovereign debt concerns, and unusual currency dynamics — making findings potentially non-generalizable. Second, both variables are likely driven by common third factors: risk appetite, macroeconomic data releases, and Federal Reserve policy decisions could simultaneously depress the dollar and reduce equity trading volumes (or vice versa), creating spurious correlation. Third, the axis labels appear to have their dataset descriptions swapped in the source metadata (each variable's description references the other dataset), which warrants verification of the data pipeline before drawing firm conclusions. Fourth, using daily data with N = 3,302 in the population context but only n = 245 sampled raises questions about whether the sample adequately captures the full distributional range.
Actionable Insights and Further Investigation Given the Granger causality finding that dollar index movements precede volume changes, practitioners could explore whether dollar index levels or directional moves serve as a useful leading indicator for equity market activity the following trading day. Recommended next steps include: (1) extending the analysis beyond 2010 to test whether this relationship persists across different market regimes; (2) incorporating VIX or implied volatility as a control variable to disentangle risk-driven co-movement; (3) testing non-linear model specifications (e.g., piecewise regression or quantile regression) given the apparent heteroscedasticity visible at higher volume levels; and (4) examining whether the relationship holds across individual exchange tapes (A, B, C) separately, as aggregated notional may mask exchange-specific dynamics. The Granger lag of just 1 period also makes this a tractable signal to evaluate in a short-horizon trading or market-microstructure context.
X dataset: Cboe U.S. Equities Historical Market Volume Data 2010
Y dataset: FRED – US Dollar Index (Trade Weighted Broad)
Part of experiment: Daily - Cboe U.S. Equities Historical Market Volume Data 2010 vs FRED – US Dollar Index (Trade Weighted Broad)