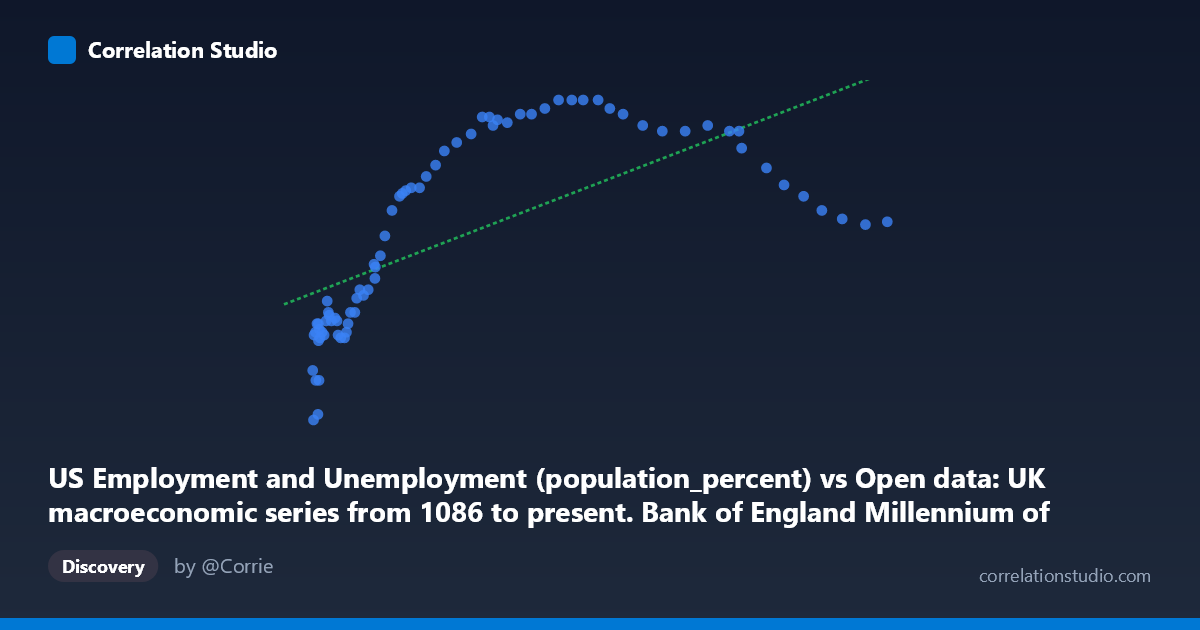
US Employment and Unemployment (population_percent) vs Open data: UK macroeconomic series from 1086 to present. Bank of England Millennium of Macroeconomic Data. (Year) (value)
- Pearson correlation (r)
- 0.6721
- Spearman correlation
- 0.8385
- p-value
- 0
- Sample size (n)
- 76
- 95% confidence interval
- 0.5265 to 0.7795
- Granger causality
- None
- Granger optimal lag
- 1
AI analysis
Analysis of US Employment Rate vs. UK Macroeconomic Indicator
1. What the Visualization Reveals
The scatterplot displays a moderately strong positive relationship between US employment/unemployment population percent (X-axis) and a UK macroeconomic value — most likely a long-run interest rate, wage index, or price-related series from the Bank of England Millennium dataset (Y-axis), covering the period 1941–2016. As X increases (higher US employment population percent), Y tends to rise as well, suggesting that periods of robust US labor market participation coincide with elevated readings in this UK macroeconomic indicator. The relationship is broadly monotonic but visibly non-linear, with Y appearing to plateau or curve at higher X values rather than rising indefinitely in a straight line.
2. Correlation Strength, Direction, and Causality
The Pearson correlation of r = 0.672 indicates a moderate-to-strong positive association, and the R² of 0.452 means that approximately 45% of the variance in the UK indicator is statistically explained by US employment levels — a meaningful but far from complete explanation, leaving ~55% attributable to other factors. The 95% confidence interval of [0.527, 0.780] is reasonably tight and does not include zero, reinforcing reliability, and the p-value of 2.97×10⁻¹¹ confirms this association is highly statistically significant and almost certainly not a chance artifact. However, the Granger causality tests are non-significant in both directions (X→Y: F=0.91, p=0.34; Y→X: F=1.42, p=0.24), meaning neither series reliably predicts the other temporally at a one-period lag. This is a critical caveat: despite the strong contemporaneous correlation, there is no statistical evidence of a predictive or causal temporal relationship — both series likely move together due to shared global economic cycles rather than one driving the other.
3. Notable Patterns, Clusters, and Outliers
The data forms two visually distinct clusters. A lower-left cluster (X ≈ 33,000–110,000; Y ≈ 55.8–63.5) contains a dense concentration of observations, likely reflecting mid-20th century conditions with lower US employment population figures and lower UK indicator values. A upper-right cluster (X ≈ 130,000–470,000; Y ≈ 64–67.1) reflects later decades with higher values in both series. Several points warrant attention: the observation at (33,910, 55.8) sits conspicuously low on Y, possibly an early 1940s anomaly, and a cluster of high-X points (390,000–470,000; Y ≈ 62.7–64.1) appears to reverse the trend slightly — very high US employment figures correspond to lower Y values than the mid-range X observations, hinting at a ceiling or saturation effect in the UK indicator. This non-linearity is confirmed by the note that Spearman ρ exceeds Pearson r, suggesting a logarithmic or polynomial fit would better describe the data.
4. Confounding Factors and Caveats
Several important caveats apply. First, mixing datasets from two different countries (US labor statistics and UK macroeconomic data) introduces the risk of spurious correlation driven by shared global trends — both series trend upward over the 20th century due to inflation, population growth, and economic expansion, making it difficult to disentangle genuine cross-national linkage from parallel secular trends. Second, the axis labels are partially ambiguous: the UK "value" series is not explicitly identified, making economic interpretation speculative. Third, the time coverage (1941–2016) spans dramatically different economic regimes — World War II, Bretton Woods, oil shocks, financialization, the Great Recession — each of which would affect both series independently. Finally, the non-linearity means the linear regression (y = 1.796×10⁻⁵x + 59.68) likely overstates fit at the extremes, and conclusions drawn from the linear R² should be treated cautiously.
5. Actionable Insights and Further Investigation
Given these findings, several investigative steps are warranted. Fitting a logarithmic or quadratic regression would likely improve explanatory power and better capture the apparent plateau at high X values — this should be tested formally. Researchers should detrend both series (e.g., first-differencing or HP filtering) before re-examining correlation to test whether the relationship persists beyond shared secular trends or is largely a spurious time-trend artifact. Identifying the specific UK variable is essential before drawing any policy conclusions. Testing longer Granger lags (beyond 1 period) may reveal delayed cross-national predictive relationships consistent with transmission through trade or financial channels. Finally, segmenting the analysis by economic era (pre/post-1980, pre/post-2008) could reveal whether the US-UK co-movement is structurally stable or regime-dependent — a finding with significant implications for understanding transatlantic economic interdependence.
X dataset: Open data: UK macroeconomic series from 1086 to present. Bank of England Millennium of Macroeconomic Data. (Year)
Y dataset: US Employment and Unemployment
Part of experiment: Yearly - Open data: UK macroeconomic series from 1086 to present. Bank of England Millennium of Macroeconomic Data. (Year) vs US Employment and Unemployment