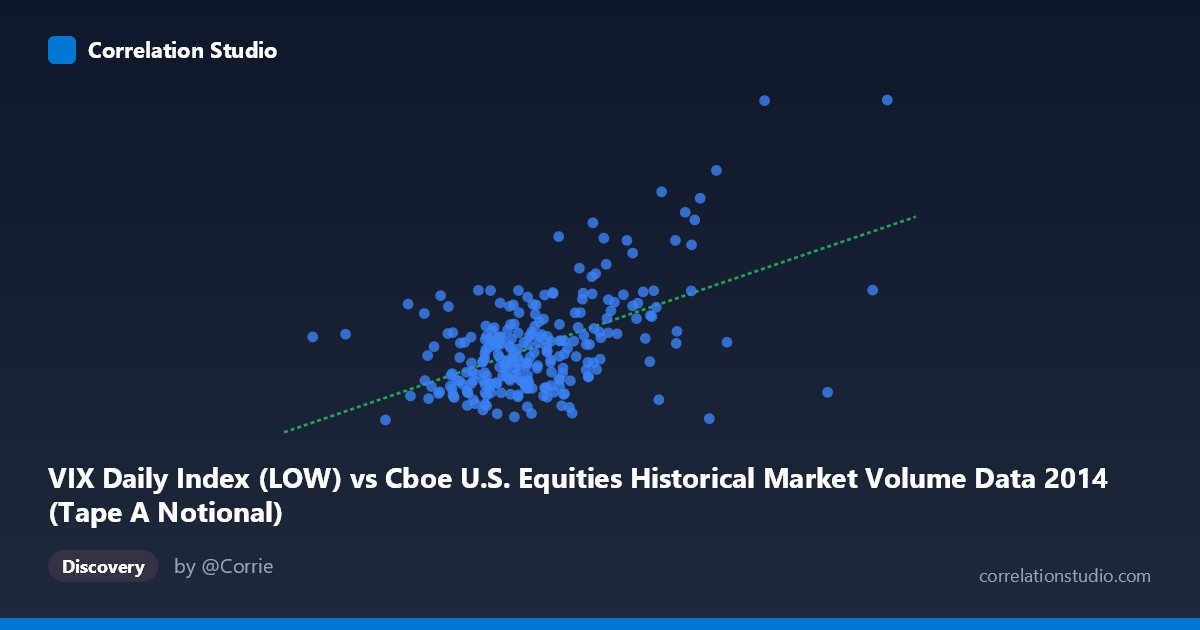
VIX Daily Index (LOW) vs Cboe U.S. Equities Historical Market Volume Data 2014 (Tape A Notional)
- Pearson correlation (r)
- 0.5315
- Spearman correlation
- 0.4159
- p-value
- 0
- Sample size (n)
- 252
- 95% confidence interval
- 0.4366 to 0.6147
- Granger causality
- None
- Granger optimal lag
- 1
- Time coverage
- 2014-01-02 to 2014-12-31
- Recomputed on refreshed data
- 2026-10-09 (r was 0.5315)
AI analysis
Scatterplot Analysis: VIX Tape A Notional vs. VIX Daily Index Low
Relationship Overview The scatterplot reveals a moderate positive relationship between the Cboe U.S. Equities Historical Market Volume (VIX Daily Index Low, X-axis) and the Tape A Notional value (Y-axis) across 252 trading days in 2014. As market volume increases, Tape A Notional values tend to rise as well, consistent with the intuitive expectation that higher trading activity correlates with greater notional value transacted. However, the scatter around the regression line (y = 6.956E-10x + 7.656) is substantial, indicating that volume alone is far from a complete predictor of notional value. The linear slope is extremely shallow in absolute terms given the billion-scale X values, but statistically meaningful within the observed range.
Correlation Strength and Statistical Significance The Pearson correlation of r = 0.5315 reflects a moderate positive association, but the more informative metric is r² = 0.2825, meaning that only 28.3% of the variance in Tape A Notional is explained by the VIX Daily Low. This leaves over 70% of variance attributable to other factors. The 95% confidence interval of [0.4366, 0.6147] is meaningfully above zero and relatively tight given n = 252, lending credibility to the result. The p-value of essentially 0 confirms the correlation is highly statistically significant within this sample. However, the Granger causality results are notable: neither X→Y (F = 1.62, p = 0.204) nor Y→X (F = 0.14, p = 0.708) achieves significance at lag 1, meaning neither variable temporally predicts the other in a meaningful way. The relationship is contemporaneous and correlational, not directionally predictive — an important caveat for any trading or operational application.
Notable Patterns, Clusters, and Outliers Several features stand out in the data. There appear to be two to three prominent outliers at the upper-right and upper-center of the chart — most notably the point near (13.56B, 24.61) and another near (11.81B, 19.60), which sit well above the regression line and likely exert disproportionate influence on the correlation coefficient. The bulk of the data clusters between X ≈ 6B–11B and Y ≈ 11–16, forming a relatively dense core cloud with moderate upward slope. There is also a suggestion of heteroscedasticity: variance in Y appears to increase at higher X values, with the upper tail showing much wider Y spread. This non-constant variance may violate ordinary least squares assumptions and warrants further inspection. A handful of low-volume, high-notional points (e.g., ~3.6B, 14.01) suggest that low volume does not necessarily suppress notional value.
Confounding Factors and Caveats Several important caveats apply. First, the dataset and axis labels suggest a possible metadata alignment issue: the X-axis is labeled as "VIX Daily Index (LOW)" from the market volume dataset, and the Y-axis as "Tape A Notional" from the VIX dataset — this cross-dataset labeling warrants careful verification that variables are correctly paired. Second, notional value is inherently influenced by price levels, meaning that on days when individual equity prices are elevated, notional value rises independently of share volume. Third, 2014 was a relatively low-volatility year for U.S. equities, which may compress the VIX range and limit generalizability. Finally, the population size (N = 3,686) versus sample size (n = 252) suggests the full dataset is substantially larger; the sampled correlation may not fully represent the population relationship.
Actionable Insights and Further Investigation Given the moderate correlation and absent Granger causality, this relationship is best treated as a concurrent association rather than a predictive signal. Analysts should consider: (1) multivariate regression incorporating price levels, VIX open/close values, and market breadth indicators to better explain the residual 71.7% variance; (2) outlier investigation — the extreme high-notional days likely correspond to specific macro events (e.g., geopolitical shocks, FOMC announcements) and should be examined contextually; (3) non-linear modeling (e.g., polynomial or quantile regression) to address apparent heteroscedasticity; (4) extending the time series beyond 2014 to test whether this relationship holds across different volatility regimes; and (5) verifying axis-to-dataset mapping to ensure the cross-labeled variables are analytically coherent before drawing operational conclusions.
X dataset: Cboe U.S. Equities Historical Market Volume Data 2014
Y dataset: VIX Daily Index
Part of experiment: Daily - Cboe U.S. Equities Historical Market Volume Data 2014 vs VIX Daily Index