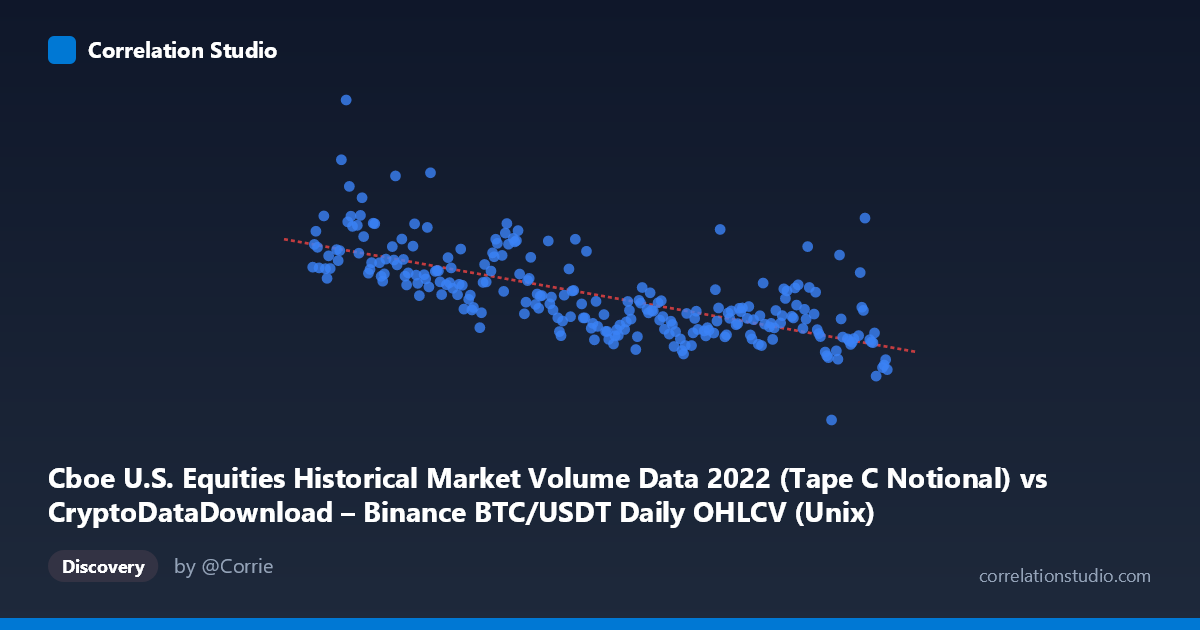
Cboe U.S. Equities Historical Market Volume Data 2022 (Tape C Notional) vs CryptoDataDownload – Binance BTC/USDT Daily OHLCV (Unix)
- Pearson correlation (r)
- -0.6972
- Spearman correlation
- -0.7241
- p-value
- 0
- Sample size (n)
- 251
- 95% confidence interval
- -0.7558 to -0.6275
- Granger causality
- None
- Granger optimal lag
- 10
AI analysis
Analysis: BTC/USDT Volume vs. Cboe U.S. Equities Volume (2022)
1. Relationship Overview
The scatterplot displays a moderate-to-strong negative relationship between Binance BTC/USDT trading activity (X-axis, timestamped) and Cboe U.S. equities notional volume (Y-axis). Note the axis labeling is somewhat inverted in the metadata—effectively this is a time-series comparison where both series are plotted against a shared timeline, with BTC volume proxied on X and equities volume on Y. As X increases (moving later into 2022), Y generally declines, consistent with the well-documented drop-off in both crypto and equity trading volumes as the year progressed from the January highs into the Q4 doldrums.
2. Strength, Direction, and Statistical Confidence
The correlation coefficient (r = -0.697) indicates a moderate-to-strong negative linear relationship. The r² of 0.486 means only about 48.6% of the variance in Cboe equities volume is explained by BTC volume (or the shared time trend)—leaving over half the variance attributable to other factors. The 95% CI [-0.756, -0.628] is reasonably tight and excludes zero, and the p-value ≈ 0 confirms this correlation is highly statistically significant and not due to chance, given n=251 paired daily observations.
However, the Granger causality results are critical for interpretation: neither direction shows significant predictive causality (X→Y: p=0.262; Y→X: p=0.082, only marginally suggestive at best). This strongly implies the correlation is not causal in a temporal/predictive sense—it's more likely that both series are independently trending downward over 2022 (a classic spurious-correlation-via-shared-trend scenario), rather than one market mechanically driving the other's volume.
3. Notable Patterns and Outliers
The data shows clear temporal clustering rather than a smooth linear decay: - Early 2022 (Jan–May): High variance with several large spikes (e.g., 21–22 billion range in late Jan/Feb, coinciding with heightened crypto volatility around the Terra/Luna collapse and broader risk-off repricing). - Mid-to-late 2022 (Aug–Dec): Values compress into a much narrower, lower band (~8–11 billion), suggesting a regime shift or volume "floor" rather than continued linear decline.
This pattern—high dispersion early, low dispersion late—suggests a non-linear, possibly step-function or exponential-decay relationship rather than a pure linear trend, meaning the linear R² may understate fit quality in the second half of the year while overstating it in the volatile first half.
4. Confounding Factors and Caveats
- Shared macro trend confound: 2022 was a broad "risk-off" year (Fed tightening, equity bear market, crypto winter). Both series likely declined due to correlated macro drivers (rising rates, reduced retail participation, reduced liquidity)—not because BTC volume causes equity volume or vice versa. - Autocorrelation: Both series are time-ordered with likely strong internal autocorrelation, which can inflate apparent cross-correlation between any two declining series (spurious regression problem). - Scale/composition mismatch: Comparing a single-exchange crypto pair (Binance BTC/USDT) to aggregate U.S. equities notional volume conflates very different market structures, participant bases, and liquidity regimes. - N vs. n discrepancy: Population N=3,212 vs. sampled n=251 suggests significant subsampling—results may be sensitive to which 251 days were selected.
5. Actionable Next Steps
1. Detrend both series (e.g., first-differencing or removing a fitted trend/seasonal component) and re-run correlation to test whether the relationship persists beyond the shared downward drift—this will reveal if there's genuine co-movement. 2. Segment the analysis by regime (Jan–May vs. Jun–Dec) to fit separate models, given the visible volatility clustering. 2b. Consider a non-linear model (log-linear or piecewise) given the apparent floor effect late in the year. 3. Given the lack of Granger causality, avoid using one series to forecast the other; instead, investigate a common third factor (e.g., VIX, Fed funds rate, or crypto-specific volatility indices) that may better explain both declines simultaneously.
X dataset: CryptoDataDownload – Binance BTC/USDT Daily OHLCV
Y dataset: Cboe U.S. Equities Historical Market Volume Data 2022
Part of experiment: Bitcoin - CryptoDataDownload – Binance BTC/USDT Daily OHLCV vs Cboe U.S. Equities Historical Market Volume Data 2022