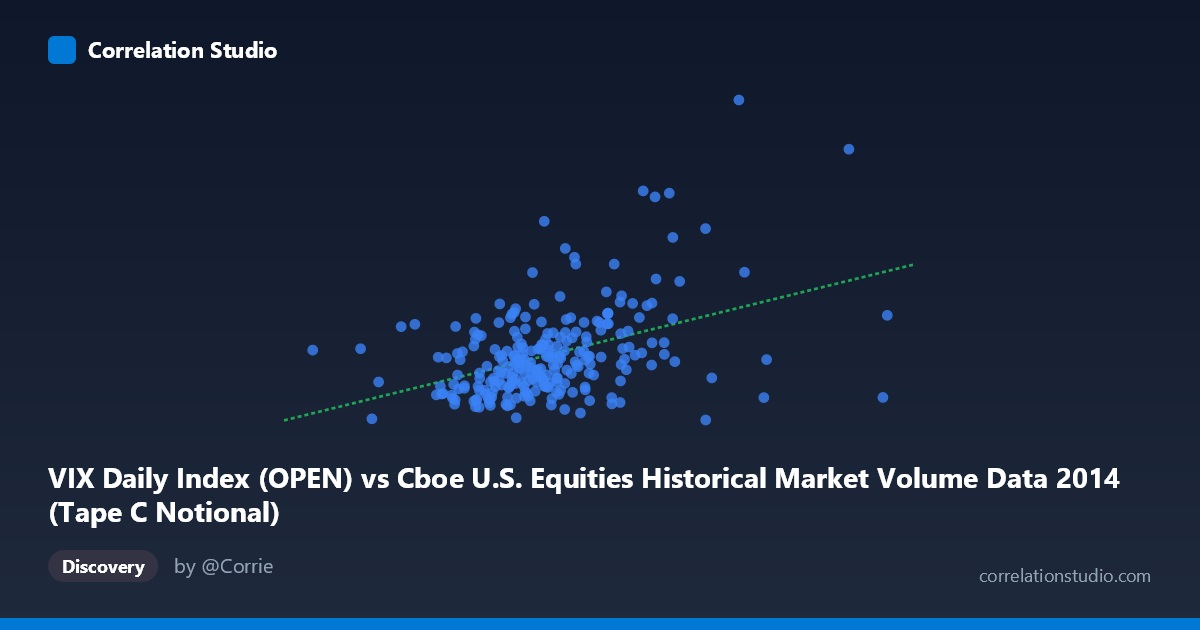
VIX Daily Index (OPEN) vs Cboe U.S. Equities Historical Market Volume Data 2014 (Tape C Notional)
- Pearson correlation (r)
- 0.422
- Spearman correlation
- 0.375
- p-value
- 0
- Sample size (n)
- 252
- 95% confidence interval
- 0.3149 to 0.5185
- Granger causality
- None
- Granger optimal lag
- 1
AI analysis
Scatterplot Analysis: VIX Open vs. Tape C Notional Volume (2014)
Relationship Overview
The scatterplot reveals a modest positive relationship between the CBOE VIX Daily Index (Open) on the x-axis and Tape C Notional trading volume on the y-axis across 252 trading days in 2014. As VIX levels rise — indicating greater expected market volatility — Tape C notional volume tends to increase as well. This is broadly consistent with market intuition: periods of heightened fear or uncertainty tend to drive elevated trading activity as market participants reposition, hedge, or liquidate holdings. However, the relationship is far from deterministic, with considerable scatter throughout the plot suggesting that many days with similar VIX levels produce very different volume outcomes.
Correlation Strength and Statistical Significance
The Pearson correlation of r = 0.422 indicates a moderate positive association, but the explanatory power is limited: r² = 0.178, meaning VIX open levels account for only about 17.8% of the variance in Tape C notional volume. The remaining ~82% of variability is driven by factors entirely outside this model. The relationship is nonetheless highly statistically significant (p = 2.645×10⁻¹²), with a 95% confidence interval of [0.315, 0.519], confirming that the positive association is unlikely to be a sampling artifact across the n=252 paired observations drawn from a population of N=3,686. That said, statistical significance here is partly a function of sample size, and the practical magnitude of the relationship is modest at best. Critically, Granger causality tests show no significant predictive direction in either direction (X→Y: F=0.0043, p=0.947; Y→X: F=0.010, p=0.920), meaning that past VIX values do not help forecast next-period Tape C volume, and vice versa — the correlation appears contemporaneous rather than temporally predictive.
Notable Patterns, Clusters, and Outliers
Several structural features stand out in the data. The bulk of observations cluster in a relatively narrow band — VIX between approximately 2.0×10⁹ and 5.5×10⁹ with Y-values between 11 and 17 — suggesting that most 2014 trading days were "normal" low-volatility days. There are, however, notable high-leverage outliers: the point near (7.18×10⁹, 29.26) and another near (6.15×10⁹, 23.55) are visually prominent and likely correspond to specific volatility events in late 2014 (e.g., the October 2014 equity selloff). Conversely, the point at approximately (6.77×10⁹, 10.40) represents an anomalously low notional volume despite high VIX, suggesting that high volatility does not universally translate to high volume. These outliers may be disproportionately driving the observed correlation coefficient, and their removal could materially weaken the r value.
Confounding Factors and Interpretive Caveats
Several caveats limit causal interpretation. First, axis labeling warrants scrutiny — the dataset notes suggest the variables may be swapped from their natural roles (VIX is listed as the Y-axis source but plotted on X), which complicates narrative framing. Second, Tape C notional volume is influenced by a wide range of concurrent factors — index rebalancing events, options expiration cycles, macroeconomic announcements, and secular trends in algorithmic trading — none of which are controlled for here. Third, the linear regression (y = 1.19×10⁻⁹x + 8.46) assumes a linear relationship, but the cluster of extreme outliers hints at a possible non-linear or threshold effect, where volume only surges dramatically above certain VIX thresholds. Finally, 2014 represents a specific regime (broadly low volatility with isolated spikes), limiting generalizability to other market environments.
Actionable Insights and Further Investigation
Given the moderate correlation and absence of Granger causality, VIX open levels alone are insufficient as a standalone predictor of Tape C notional volume. Practitioners should: (1) investigate the extreme outlier dates to determine whether episodic events (e.g., geopolitical shocks, Fed announcements) are driving the correlation rather than a stable structural relationship; (2) test non-linear specifications (e.g., quadratic or spline regression) to assess whether a threshold effect better describes the data; (3) incorporate additional predictors such as realized volatility, put/call ratios, or macro release calendars in a multivariate framework; and (4) replicate the analysis across multiple years to determine whether the 0.42 correlation is stable across different volatility regimes or an artifact of 2014's specific market dynamics. The lack of Granger causality also suggests that any trading strategy relying on lagged VIX to time volume — and therefore liquidity — would not be supported by this data.
X dataset: Cboe U.S. Equities Historical Market Volume Data 2014
Y dataset: VIX Daily Index
Part of experiment: Daily - Cboe U.S. Equities Historical Market Volume Data 2014 vs VIX Daily Index