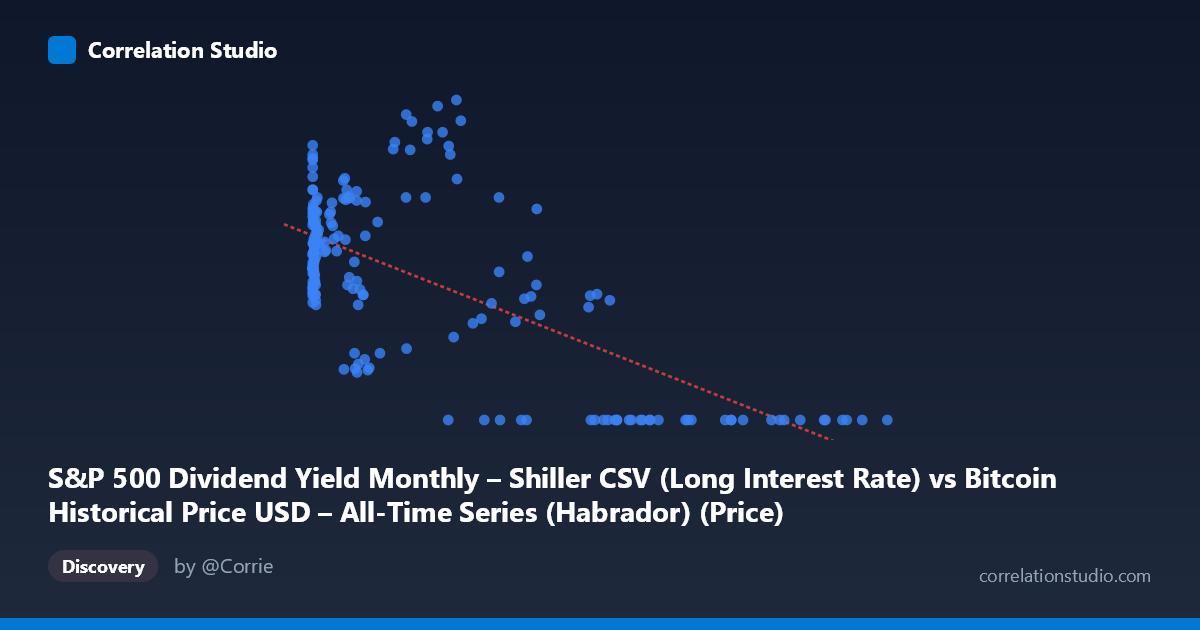
S&P 500 Dividend Yield Monthly – Shiller CSV (Long Interest Rate) vs Bitcoin Historical Price USD – All-Time Series (Habrador) (Price)
- Pearson correlation (r)
- -0.6767
- Spearman correlation
- -0.5167
- p-value
- 0
- Sample size (n)
- 194
- 95% confidence interval
- -0.7464 to -0.5923
- Granger causality
- None
- Granger optimal lag
- 1
- Time coverage
- 2010-08-01 to 2026-09-01
- Recomputed on refreshed data
- 2026-10-24 (r was -0.6533)
AI analysis
Analysis: Bitcoin Price vs. S&P 500 Dividend Yield / Long Interest Rate
Note on column labeling: The axis labels appear swapped/misaligned (X is described as "Dividend Yield" but ranges to 118,670, clearly Bitcoin price data; Y ranges 0-4.17, consistent with a yield/rate metric). This analysis treats X as Bitcoin price (USD) and Y as the interest rate/yield series, based on the actual data ranges.
1. Relationship Overview
The scatterplot shows a clear negative, non-linear relationship. At low X values (under ~1,000), Y clusters tightly between 1.6 and 3.6, showing high variance but no strong trend. As X increases past ~20,000, Y values increasingly collapse toward 0, with a dense cluster of near-zero readings appearing consistently between X = 35,000 and 118,670. This creates a distinctive "L-shaped" or hyperbolic decay pattern rather than a straight-line relationship.
2. Strength, Direction, and Statistical Confidence
The correlation coefficient (r = -0.65) indicates a moderately strong negative relationship, with r² = 0.427 meaning Bitcoin price explains about 43% of the variance in the rate/yield variable — leaving over half unexplained by this single variable. The 95% CI [-0.728, -0.563] is reasonably tight and excludes zero, and the p-value of 0 (effectively <0.001) confirms this relationship is statistically robust, not a chance artifact of the 189-point sample. However, the Granger causality test reveals an important asymmetry: Y Granger-causes X (F=4.87, p=0.029), while X does NOT Granger-cause Y (F=0.83, p=0.365). This suggests the interest rate/yield series has predictive temporal information for future Bitcoin price movements, but Bitcoin price history does not meaningfully predict future rate changes — the opposite of what a naive reading of "Bitcoin drives yields" might suggest.
3. Notable Patterns and Outliers
Several features stand out: (a) a saturation/floor effect where Y→0 for nearly all X60,000, suggesting a structural ceiling or regime change rather than continuous decay; (b) high scatter at low X (Y ranging 0.87–4.17) indicating other drivers dominate in that regime; (c) a few mid-range anomalies like (58724.66, 1.64) and (45092.81, 1.61) that break the otherwise clean high-X/low-Y pattern; (d) the extreme low-X points (X<1) show elevated Y (2.65–3.58), hinting at a possible inverse-power or logarithmic relationship rather than linear decay.
4. Confounding Factors and Caveats
The mismatched axis descriptions are a major red flag — verify data provenance before drawing conclusions. Both series are time-indexed (2010–2026) and likely non-stationary trending series (Bitcoin price is exponential-growth-like; long rates have secularly declined then risen post-2020), making this a classic case of spurious correlation risk from shared temporal trends rather than genuine causal linkage. Structural breaks (COVID, 2022 rate-hiking cycle) could be driving both series independently. The linear R² of 0.427 is a poor fit given the visibly non-linear (hyperbolic/log) shape — true explanatory power for a properly-specified model could differ substantially.
5. Suggested Next Steps
Given the non-stationarity risk, run cointegration tests (Engle-Granger or Johansen) before trusting the Granger causality result. Re-fit using log(X) or 1/X transformations given the L-shaped pattern — this could substantially improve R². Investigate the 45,000–60,000 X-range outliers with elevated Y as potential regime-specific events. Finally, confirm axis/column mapping with the data source before publishing any causal narrative, since the current inversion undermines interpretability.
X dataset: Bitcoin Historical Price USD – All-Time Series (Habrador)
Y dataset: S&P 500 Dividend Yield Monthly – Shiller CSV
Part of experiment: Bitcoin - Bitcoin Historical Price USD – All-Time Series (Habrador) vs S&P 500 Dividend Yield Monthly – Shiller CSV