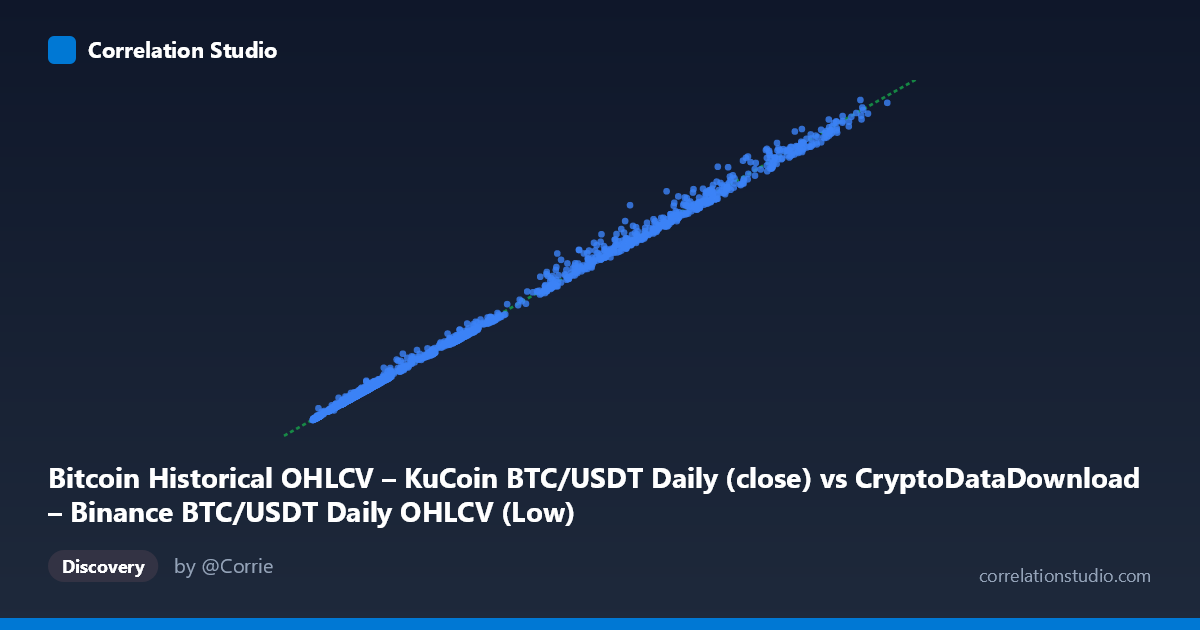
Bitcoin Historical OHLCV – KuCoin BTC/USDT Daily (close) vs CryptoDataDownload – Binance BTC/USDT Daily OHLCV (Low)
- Pearson correlation (r)
- 0.999
- Spearman correlation
- 0.9987
- p-value
- 0
- Sample size (n)
- 1861
- 95% confidence interval
- 0.9989 to 0.9991
- Granger causality
- None
- Granger optimal lag
- 10
AI analysis
Analysis: BTC/USDT Price Correlation (Binance Close vs. KuCoin Low)
1. What the Visualization Reveals
This scatterplot compares Bitcoin's daily closing price on Binance against its daily low price on KuCoin over a ~5-year span (2017–2022). The relationship is essentially a tight, near-perfect straight line running from the lower-left (~$3,000-4,000 range) to the upper-right (~$60,000-67,000 range), reflecting BTC's full market cycle from early bull run through the 2020-2021 surge and subsequent volatility. The data points hug the regression line closely at all price levels, with no visible fanning, curvature, or regime shifts — indicating the relationship is stable and linear across three orders of magnitude in price.
2. Strength, Direction, and Statistical Meaning
The correlation is essentially as strong as it gets in real-world data: r = 0.9990, r² = 0.998, meaning 99.8% of the variance in KuCoin's daily low is explained by Binance's daily close. The 95% CI [0.9989, 0.9991] is extremely narrow, and p ≈ 0 confirms this isn't a chance artifact — with N=1,861 daily observations, the finding is highly reliable statistically. However, the Granger causality test found no significant predictive direction either way (X→Y: p=0.487; Y→X: p=0.476). This is the critical nuance: high correlation here reflects contemporaneous co-movement, not one exchange leading or forecasting the other. Both series are simply tracking the same underlying asset price in near-real-time, so neither offers meaningful lead/lag forecasting power at the tested lag structure (10 periods).
3. Notable Patterns and Features
The regression slope (1.032) is slightly above 1.0, with a small positive intercept (30.12), suggesting KuCoin's low is systematically a touch higher than Binance's close, especially at larger price magnitudes — a modest multiplicative divergence rather than a fixed offset. No discrete clusters or outlier clouds are apparent; the sampled points show consistent alignment even during the high-volatility periods (e.g., the $40,000-50,000 range, corresponding to the 2021 bull run) where spread might be expected to widen due to increased volatility and cross-exchange arbitrage lag. This absence of divergence during high-volatility periods is itself notable — it suggests efficient arbitrage kept exchanges tightly coupled even during turbulent price action.
4. Confounding Factors and Caveats
The near-perfect correlation is unsurprising and somewhat tautological: both variables measure the same underlying asset (BTC/USDT) on different exchanges, which are linked by arbitrage, shared order flow, and common market sentiment — not independent phenomena. This is fundamentally different from correlating two distinct economic variables. Key caveats: (a) "Close" vs. "Low" are different daily statistics, so some of the residual variance likely reflects each day's intraday volatility range rather than true cross-exchange discrepancy; (b) daily aggregation masks intraday lead-lag dynamics that might exist at finer (minute/hourly) resolution — the Granger test's null result may partly be an artifact of using daily-lag windows too coarse to capture rapid arbitrage adjustments; (c) both series may be non-stationary (trending with the market), which can artificially inflate correlation and destabilize causality tests unless differenced or log-transformed first.
5. Actionable Insights
For practical purposes (e.g., arbitrage monitoring, exchange risk management, or data validation), this relationship confirms these two price feeds are highly interchangeable for macro trend analysis, though the slight slope deviation (1.032) merits investigation — it could indicate a small systematic premium/fee structure difference between exchanges or a data unit/timestamp misalignment. Suggested next steps: (1) re-run Granger causality on returns or log-differenced, stationarity-corrected series rather than raw levels, and at finer (hourly) granularity, to properly test for genuine lead-lag arbitrage signals; (2) examine residuals (Y − predicted Y) over time to check whether the KuCoin premium widens during specific volatility regimes or low-liquidity periods; (3) if using this for trading signals, focus on the residual spread rather than the levels, since the levels are trivially cointegrated by construction.
X dataset: CryptoDataDownload – Binance BTC/USDT Daily OHLCV
Y dataset: Bitcoin Historical OHLCV – KuCoin BTC/USDT Daily
Part of experiment: Bitcoin - CryptoDataDownload – Binance BTC/USDT Daily OHLCV vs Bitcoin Historical OHLCV – KuCoin BTC/USDT Daily