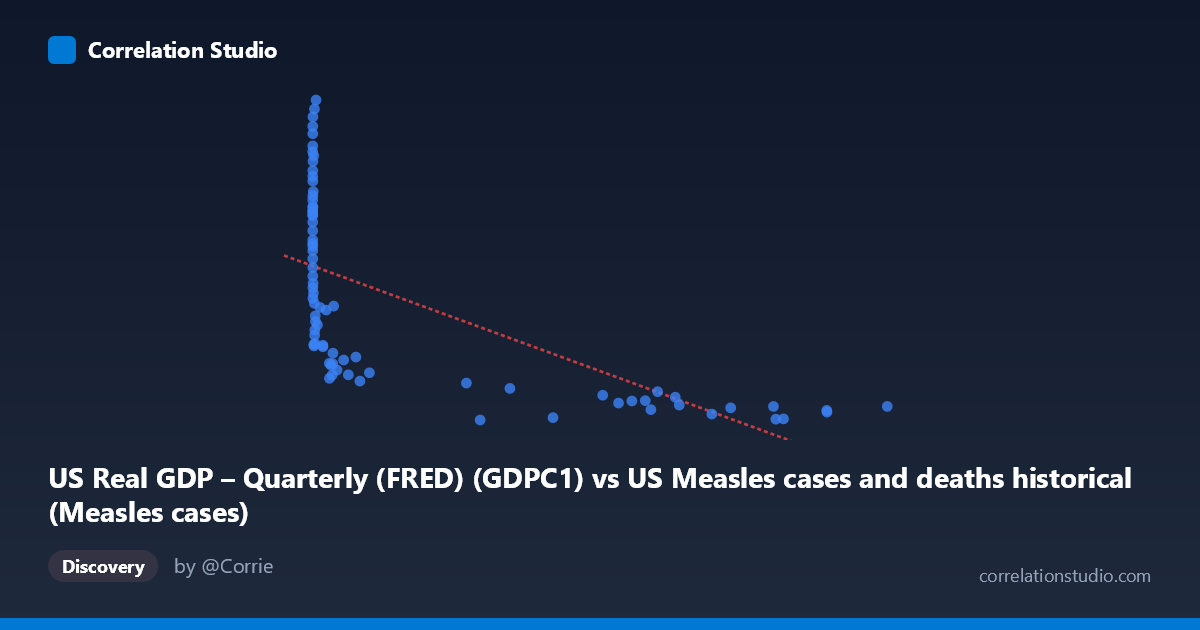
US Real GDP – Quarterly (FRED) (GDPC1) vs US Measles cases and deaths historical (Measles cases)
- Pearson correlation (r)
- -0.6415
- Spearman correlation
- -0.8853
- p-value
- 0
- Sample size (n)
- 80
- 95% confidence interval
- -0.7548 to -0.491
- Granger causality
- None
- Granger optimal lag
- 10
- Time coverage
- 1947-01-01 to 2026-01-01
- Recomputed on refreshed data
- 2026-10-17 (r was -0.6416)
AI analysis
Analysis: US Real GDP vs. US Measles Cases
1. Overall Relationship Revealed
The scatterplot reveals a clear negative relationship between US Real GDP and US Measles cases — as GDP grows, reported measles cases decline substantially. However, the relationship is visibly non-linear: the steepest decline in measles cases occurs at lower GDP values, with the curve flattening considerably at higher GDP levels. This hyperbolic or logarithmic shape is consistent with the note that Spearman ρ exceeds Pearson r, confirming that a linear model is a meaningful but imperfect description of the underlying pattern. The data spans 1947–2025, so what is really being observed is a long-run historical trajectory — rising postwar prosperity alongside progressive disease control — rather than a controlled experimental comparison.
2. Correlation Strength, Direction, and Causality
The Pearson r of −0.647 indicates a moderate-to-strong negative correlation, and the R² of 0.4185 means that GDP alone explains roughly 42% of the variance in measles case counts — substantial, but leaving 58% attributable to other factors. The 95% confidence interval of [−0.759, −0.497] is entirely negative and well away from zero, and the p-value of 1.19 × 10⁻¹⁰ makes the association statistically unambiguous. The Granger causality test adds an important temporal dimension: GDP unidirectionally Granger-causes measles cases (F = 2.10, p = 0.042) at a 10-period lag, while the reverse direction is not significant (p = 0.321). This suggests that changes in GDP have some temporal predictive power over subsequent measles trends — consistent with the idea that economic growth enables public health investment — though Granger causality establishes predictive precedence, not true mechanistic causation.
3. Patterns, Clusters, and Outliers
Two broad clusters are visually apparent. The left cluster (low GDP, roughly < 50,000 units) shows enormous scatter in measles cases, ranging from ~2,200 to over 23,500 — representing the pre- and early-vaccination era (late 1940s through mid-1960s) when case counts were both high and volatile. The right cluster (high GDP, 200,000) compresses tightly near the x-axis with consistently low case counts (2,000–5,000), reflecting the post-vaccination modern era. Several notable outliers exist in the low-GDP region: points such as (2288, 23548), (285, 23082), (59, 22440), and (1274, 20432) represent extremely high case years despite very low GDP — likely corresponding to pre-vaccine epidemic years. The point (121, 21933) also stands out as anomalously high. These high-leverage points at the left tail heavily influence the linear fit.
4. Confounding Factors and Caveats
The most critical caveat is that GDP and measles cases are both proxies for time — this is fundamentally a time-series correlation where a third variable (the 1963 introduction of the measles vaccine) is likely the dominant driver of case reduction. GDP rose monotonically over the same period the vaccine was deployed and expanded, creating a spurious-seeming correlation. Additional confounders include improvements in sanitation, population density changes, herd immunity thresholds, public health infrastructure, and reporting methodology changes over decades. The 10-period Granger lag (~10 years at annual frequency) is also unusually long and may reflect co-trending rather than genuine predictive causation. Furthermore, the linear regression model (y = −0.0186x + 12,619) is structurally inappropriate for this data given the evident non-linearity, and using it for prediction at any specific GDP level would be unreliable.
5. Actionable Insights and Further Investigation
Immediate improvements should include fitting a logarithmic or power-law model (consistent with the Spearman Pearson signal) to better capture the hyperbolic decline. More importantly, this analysis should be stratified by vaccination era (pre-1963, 1963–2000, post-2000) to disentangle vaccine effects from economic effects — it is likely the GDP correlation weakens dramatically or disappears entirely within each era. A multivariate regression incorporating vaccination coverage rates, public health spending, and school immunization mandate data would provide a far more honest attribution of variance. The Granger causality result warrants replication with a Vector Autoregression (VAR) model controlling for vaccine rollout as a structural break. Finally, examining whether GDP predicts measles in countries that introduced vaccines at different times (a natural experiment) could help isolate whether economic development has an independent effect on disease burden beyond its correlation with vaccination programs.
X dataset: US Measles cases and deaths historical
Y dataset: US Real GDP – Quarterly (FRED)
Part of experiment: Yearly - US Measles cases and deaths historical vs US Real GDP – Quarterly (FRED)