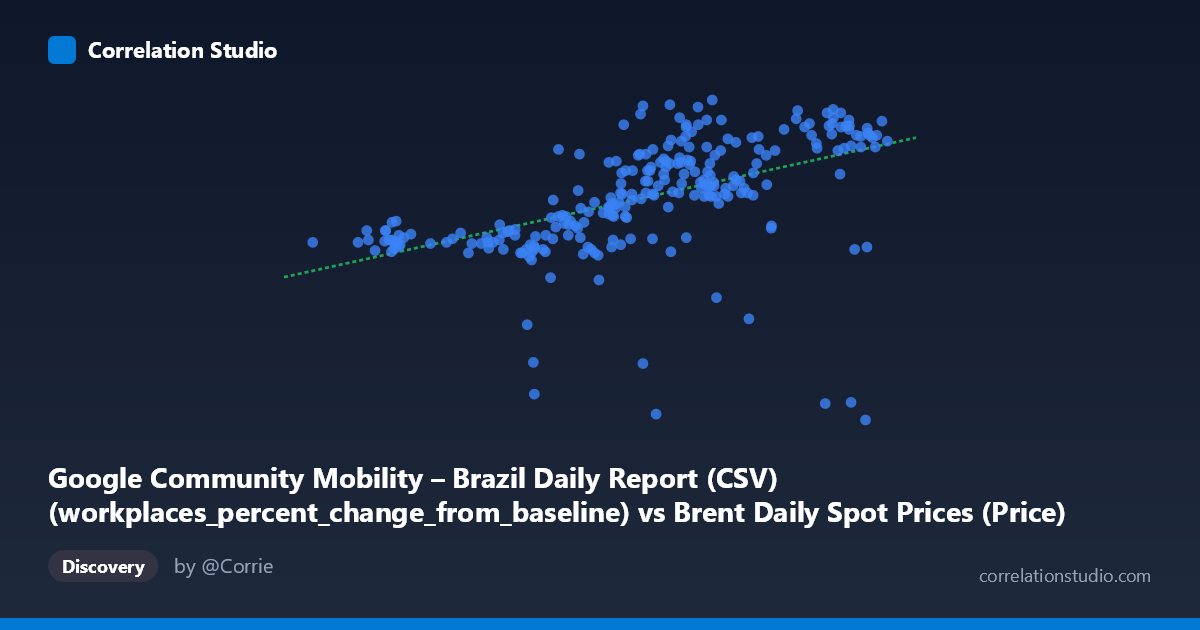
Google Community Mobility – Brazil Daily Report (CSV) (workplaces_percent_change_from_baseline) vs Brent Daily Spot Prices (Price)
- Pearson correlation (r)
- 0.5069
- Spearman correlation
- 0.6752
- p-value
- 0
- Sample size (n)
- 253
- 95% confidence interval
- 0.4092 to 0.5932
- Granger causality
- Y → X
- Granger optimal lag
- 1
AI analysis
Scatterplot Analysis: Brent Oil Prices vs. Brazil Workplace Mobility
1. Overall Relationship Pattern
The scatterplot reveals a moderate positive association between Brent crude oil spot prices (X-axis) and Brazil workplace mobility change from baseline (Y-axis). As oil prices rise, workplace mobility tends to increase — moving from negative percent changes (below baseline) at lower price levels toward positive changes at higher price levels. The linear regression line (y = 1.015x − 69.87) captures a general upward trend, though the scatter around this line is substantial. Notably, the data spans a meaningful economic range: oil prices from ~$50 to ~$86/barrel and mobility ranging from −61% to +30% from baseline, reflecting the highly volatile post-COVID recovery environment of 2021.
2. Correlation Strength, Direction, and Causality
The Pearson r of 0.507 indicates a moderate positive correlation, but the more telling statistic is r² = 0.257 — meaning Brent oil prices explain only about 25.7% of the variance in Brazilian workplace mobility. Nearly three-quarters of mobility variation is driven by other factors entirely. The 95% confidence interval [0.409, 0.593] is reasonably tight and well above zero, and the p-value of essentially 0 confirms this is not a chance finding across the N=1,095 population. However, statistical significance with large samples does not imply practical importance, and the explained variance here is modest at best. The Granger causality result is particularly revealing: Y (mobility) Granger-causes X (oil prices) unidirectionally at lag 1 (F=5.45, p=0.020), while X→Y shows no predictive power (F=0.0004, p=0.984). This means past Brazilian workplace mobility has temporal predictive value for next-day Brent prices, not the reverse — an economically intuitive finding given Brazil's role as a major oil-consuming and producing economy where economic activity signals feed into global energy demand expectations.
3. Notable Patterns, Clusters, and Outliers
Several structural features stand out in the data:
- Two distinct clusters are visible: a lower-left grouping (oil ~$50–65, mobility −60% to −5%) and a denser upper-right cluster (oil ~$70–86, mobility −10% to +30%), suggesting possible regime shifts or seasonal phases rather than a smooth continuum - At least two severe outliers are apparent — points near (64, −54) and (82, −56), where mobility collapsed despite normal or high oil prices. These likely correspond to specific COVID lockdown events or holiday periods in Brazil - The Spearman ρ exceeding Pearson r (as flagged) confirms the relationship is better described as monotonic but non-linear, with the association being stronger at the tails; a logarithmic or polynomial fit would likely improve model performance - There is notably greater variance in Y at mid-range X values (~$70–78), suggesting heteroscedasticity that violates a key linear regression assumption
4. Confounding Factors and Interpretive Caveats
This correlation almost certainly reflects shared temporal confounding rather than a direct causal mechanism between workplace mobility and oil prices. Both variables were jointly driven by the global COVID-19 recovery trajectory throughout 2021 — as vaccination rollouts progressed and restrictions lifted, economic activity (mobility) and commodity demand (oil prices) rose together. Additional confounders include: Brazilian seasonal patterns (Carnival, school holidays), variant waves (Delta, beginning of Omicron) causing mobility shocks independent of oil prices, BRL/USD exchange rate fluctuations, and OPEC+ production decisions driving oil prices independent of Brazilian demand. The dataset mismatch in variable labeling also warrants caution — the X and Y axis source datasets appear swapped in naming convention, which should be verified before drawing firm conclusions.
5. Actionable Insights and Further Investigation
Given the Granger causality finding, the most actionable next step is to build a short-horizon forecasting model for oil prices using lagged Brazilian workplace mobility, potentially alongside other high-frequency mobility indicators from major oil-consuming economies. Specific recommendations:
- Test polynomial (quadratic) and log-linear regression to better capture the non-linear monotonic relationship flagged by Spearman ρ - Remove or separately model the outlier lockdown events to assess whether the underlying relationship is substantially stronger during "normal" operating conditions - Incorporate additional Google Mobility categories (retail, transit, residential) to determine whether workplace mobility specifically drives the signal or whether composite economic activity is the true predictor - Extend the analysis beyond 2021 to test whether the Granger causality relationship holds outside the unique COVID recovery period, as this would validate its structural rather than coincidental nature - Apply rolling-window correlation analysis to detect whether the relationship strengthened or weakened across the year's distinct COVID phases
X dataset: Brent Daily Spot Prices
Y dataset: Google Community Mobility – Brazil Daily Report (CSV)
Part of experiment: Daily - Brent Daily Spot Prices vs Google Community Mobility – Brazil Daily Report (CSV)