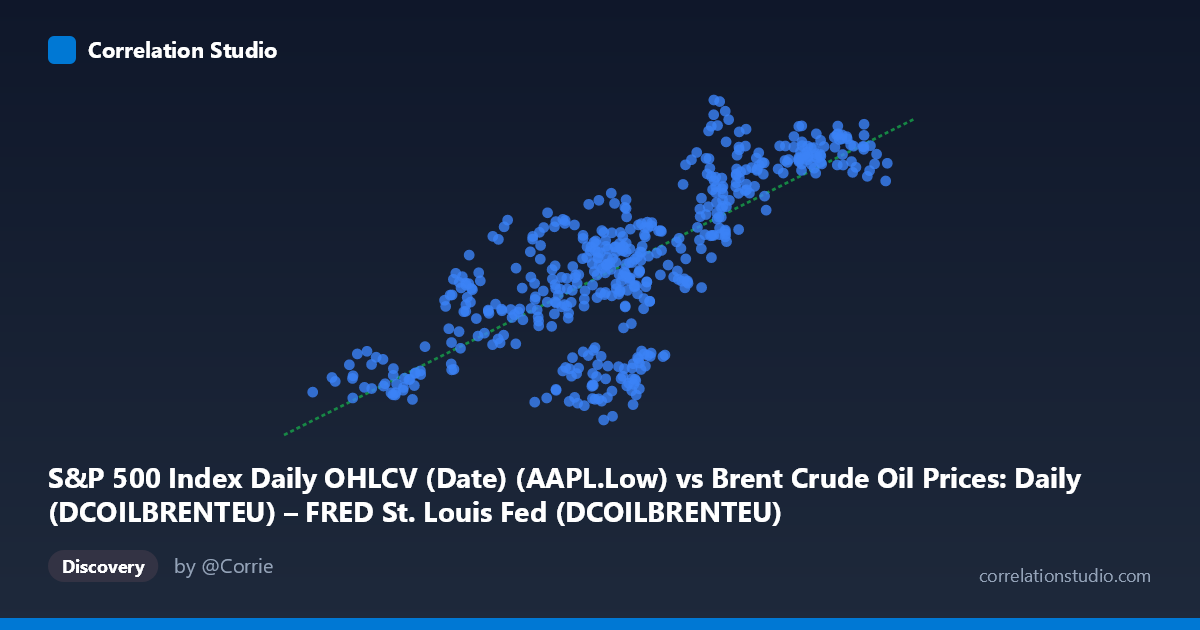
S&P 500 Index Daily OHLCV (Date) (AAPL.Low) vs Brent Crude Oil Prices: Daily (DCOILBRENTEU) – FRED St. Louis Fed (DCOILBRENTEU)
- Pearson correlation (r)
- 0.7704
- Spearman correlation
- 0.7654
- p-value
- 0
- Sample size (n)
- 504
- 95% confidence interval
- 0.7324 to 0.8037
- Granger causality
- None
- Granger optimal lag
- 1
AI analysis
Analysis: AAPL Low Price vs. Brent Crude Oil Price (2015–2017)
Relationship Overview The scatterplot reveals a moderately strong positive relationship between Apple's daily low stock price (X-axis) and Brent Crude Oil spot prices (Y-axis) over a two-year window from February 2015 to February 2017. As AAPL's low price increases from roughly $26 to $66, Brent crude tends to rise from approximately $89 to $135. The linear regression equation (y = 1.013x + 63.05) suggests a near 1:1 slope, meaning each dollar increase in AAPL's low is associated with approximately a $1 increase in Brent crude — a numerically striking but almost certainly coincidental relationship driven by shared macroeconomic timing rather than any direct mechanism.
Correlation Strength and Statistical Significance The Pearson correlation of r = 0.770 is statistically robust, with a 95% confidence interval of [0.732, 0.804] and a p-value effectively at zero, confirming the association is not a sampling artifact across 504 paired observations. However, R² = 0.594 means that only about 59% of the variance in Brent crude prices is explained by AAPL's low price — leaving 41% unexplained by this model. While the correlation is strong by conventional benchmarks, it is critical to note that statistical significance does not imply economic causation. The Granger causality tests reinforce this caution decisively: neither direction shows predictive power (X→Y: F = 0.012, p = 0.912; Y→X: F = 0.263, p = 0.609). Neither series temporally predicts the other at a 1-period lag, meaning this correlation offers no forecasting leverage in either direction.
Patterns, Clusters, and Outliers Several structural features are visible in the sample points. There is a notable lower-left cluster around AAPL Low ≈ $29–37 and Brent ≈ $93–110, corresponding likely to the oil price trough and AAPL weakness in early-to-mid 2015 and early 2016. An upper-right cluster around AAPL ≈ $55–66 and Brent ≈ $123–135 reflects a recovery phase. A few points appear as potential outliers — notably (46.08, 92.46) and (41.59, 92.00), which show relatively moderate AAPL prices paired with unusually low Brent prices, sitting below the regression line, and (54.16, 134.84), which sits at the upper extreme of Brent prices. The relationship also appears to have mild heteroscedasticity, with greater vertical spread at mid-range AAPL values, suggesting the linear model may not fully capture the underlying dynamics.
Confounding Factors and Caveats This correlation is a textbook example of spurious correlation driven by shared temporal trends. Both AAPL stock and Brent crude experienced significant price recoveries during 2015–2017 following the oil price collapse of 2014–2016 and broader equity market cycles. The shared time dimension means both series are likely co-trending with common macro drivers — global risk appetite, USD strength, Federal Reserve policy, and general economic sentiment — rather than influencing each other directly. The data also carry a dataset labeling anomaly: the axis labels appear swapped in the metadata (AAPL Low is sourced from the Brent dataset file and vice versa), which should be verified before any formal reporting. Additionally, the use of daily non-stationary price levels (rather than returns or differenced series) inflates correlation estimates and is a well-known methodological pitfall in time series analysis.
Actionable Insights and Further Investigation Given the absence of Granger causality, this correlation should not be used for trading signals or predictive modeling in its current form. Several follow-up analyses are warranted: (1) Re-run the correlation on first-differenced or log-return series to remove shared trend components and test whether any true co-movement persists; (2) Introduce explicit macro controls (e.g., USD index, VIX, S&P 500 broad index) to assess whether the AAPL-Brent association survives as an independent signal or dissolves as a common-factor artifact; (3) Apply rolling window correlation analysis to determine whether the relationship strengthens or weakens across sub-periods, which would reveal whether this is a stable structural feature or a transient coincidence; (4) Investigate the apparent outliers (e.g., early 2016 oil crash period) through regime-based segmentation to understand if the relationship behaves differently under stress conditions.
X dataset: Brent Crude Oil Prices: Daily (DCOILBRENTEU) – FRED St. Louis Fed
Y dataset: S&P 500 Index Daily OHLCV (Date)
Part of experiment: Daily - Brent Crude Oil Prices: Daily (DCOILBRENTEU) – FRED St. Louis Fed vs S&P 500 Index Daily OHLCV (Date)