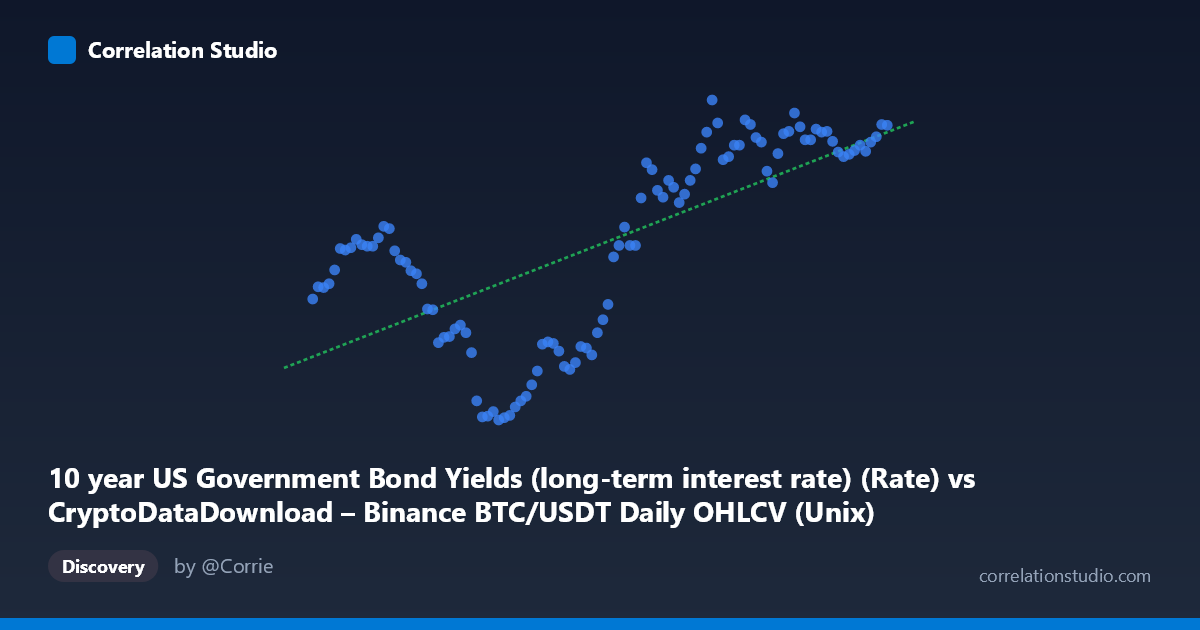
10 year US Government Bond Yields (long-term interest rate) (Rate) vs CryptoDataDownload – Binance BTC/USDT Daily OHLCV (Unix)
- Pearson correlation (r)
- 0.6754
- Spearman correlation
- 0.6949
- p-value
- 0
- Sample size (n)
- 104
- 95% confidence interval
- 0.555 to 0.7681
- Granger causality
- Y → X
- Granger optimal lag
- 2
AI analysis
Analysis: BTC/USDT Price vs. 10-Year US Treasury Yield
Note on axis labeling: The axis labels appear swapped in the metadata — the X-axis is described as Treasury yields while values shown (1.5–1.78 trillion range) are clearly Unix timestamps, and Y-axis (0.62–4.80) matches typical 10-year yield percentages. This analysis treats X = time (2017–2026) and Y = 10-year Treasury yield (%), which aligns with the actual data pattern.
1. What the Visualization Reveals
The scatterplot shows a clear secular trend in long-term interest rates over the 2017–2026 window rather than a simple bivariate relationship between two independent variables. Yields start low (~2.3–2.9%) in 2017–2019, collapse to near-zero (0.62–0.87%) during 2020–2021 (consistent with COVID-era Fed easing), and then rise sharply and persistently from 2022 onward, reaching 3.5–4.5%+ through 2023–2026. This is a time-series with a strong non-monotonic (U-shaped/regime-shift) trajectory, not a stable linear association.
2. Strength, Direction, and Predictive Direction
The reported r = 0.675 (R² = 0.456) indicates a moderate-to-strong positive linear relationship, meaning roughly 46% of the variance in yields is "explained" by the linear time trend — but 54% is not, consistent with the visible regime shifts (the 2020–2021 dip breaks linearity badly). The 95% CI [0.555, 0.768] is reasonably tight and excludes zero, and the p-value (3.8E-15) confirms this relationship is highly unlikely due to chance given n=104. However, since X here is essentially a time index, correlation with time is not particularly informative about causal drivers of yields — it just confirms yields have trended upward over the sample period. The Granger causality result (Y→X significant at p=0.038, X→Y not significant at p=0.225) is the more interesting finding: it suggests yields have some predictive information for future BTC price movements at a 2-period lag, but not vice versa. This hints that rate movements may lead crypto price action in this sample, though the weak F-statistic (3.38) and borderline p-value warrant caution against strong causal claims.
3. Notable Patterns and Outliers
The most salient feature is the non-linear, regime-based shape: a plateau (2017–19), a sharp trough (2020–21), and a steep sustained climb (2022–26). This is not well-captured by a single linear fit — the R²=0.456 undersells how well a piecewise or logistic/spline model would fit. The 2020–2021 cluster (yields 0.62–0.87%) stands out as a clear outlier regime driven by pandemic monetary policy rather than organic trend, and could disproportionately anchor the linear regression's slope estimate.
4. Confounding Factors and Caveats
Because X is a time proxy, any "correlation" with BTC price is likely spurious or mediated by broader macro conditions (Fed policy, inflation, risk-on/risk-off cycles, global liquidity) rather than a direct mechanical link between bond yields and crypto prices. Both series are non-stationary trending time series, which inflates correlation coefficients (a classic spurious regression problem) — this should be tested with differenced/detrended data or cointegration analysis rather than raw levels. The n=104 sample from a population of 877 also raises questions about how sampling was done across the full time range (every-2nd-point subsampling in a 9-year span may under-represent within-year volatility).
5. Actionable Insights
Given the trending nature of both series, analysts should re-run correlation and Granger tests on first-differenced or log-return data to remove trend-driven spurious correlation and test genuine short-run co-movement. The tentative Y→X Granger signal is intriguing and merits testing with more lags, robustness checks (VAR model diagnostics), and out-of-sample validation before treating yields as a leading indicator for BTC pricing. Segmenting the analysis by macro regime (pre-COVID, COVID-easing, post-2022 hiking cycle) would likely reveal far more actionable, non-spurious relationships than the pooled full-sample linear correlation currently provides.
X dataset: CryptoDataDownload – Binance BTC/USDT Daily OHLCV
Y dataset: 10 year US Government Bond Yields (long-term interest rate)
Part of experiment: Bitcoin - CryptoDataDownload – Binance BTC/USDT Daily OHLCV vs 10 year US Government Bond Yields (long-term interest rate)