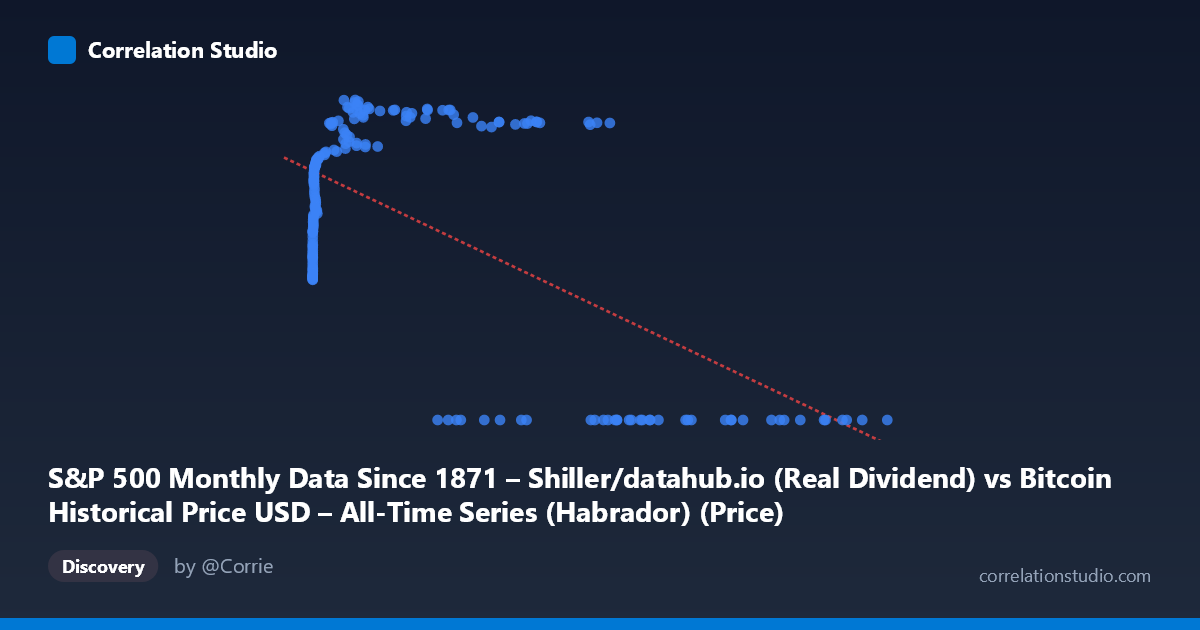
S&P 500 Monthly Data Since 1871 – Shiller/datahub.io (Real Dividend) vs Bitcoin Historical Price USD – All-Time Series (Habrador) (Price)
- Pearson correlation (r)
- -0.6314
- Spearman correlation
- -0.077
- p-value
- 0
- Sample size (n)
- 194
- 95% confidence interval
- -0.7092 to -0.5384
- Granger causality
- X → Y
- Granger optimal lag
- 5
- Time coverage
- 2010-08-01 to 2026-09-01
- Recomputed on refreshed data
- 2026-10-24 (r was -0.6026)
AI analysis
Analysis: Bitcoin Price vs. S&P 500 Real Dividend
1. What the Visualization Reveals
The scatterplot shows a distinctly non-linear, non-monotonic relationship rather than a simple linear correlation. At low X values (roughly 0–100), Y climbs steeply from ~31 to ~45. In the mid-range (X ~100–40,000), Y continues rising, peaking around 65–71. But at high X values (50,000), Y collapses abruptly to 0. This creates a pattern that looks less like a linear decline and more like an inverted-U or a "rise-then-cliff" shape, with a cluster of zero-Y points dominating the high-X region.
2. Strength, Direction, and Statistical Meaning
The reported r = -0.603 (r² = 0.363) indicates a moderate negative linear association, but this figure is misleading given the visible non-linearity — the linear fit is capturing the net effect of the late collapse to zero, not a genuine proportional decline throughout the range. The 95% CI [-0.686, -0.503] is fairly tight and excludes zero, and p ≈ 0 confirms this negative association is statistically robust across the 189 sampled pairs. Practically, 36% variance explained means X is a meaningful but incomplete predictor of Y — nearly two-thirds of Y's variance comes from elsewhere. The Granger result is notable: X→Y is significant (p=0.033) while Y→X is not (p=0.101), suggesting X's past values help predict Y with a 4-period lag, but not vice versa — hinting at a unidirectional temporal dependency, though Granger causality here does not imply mechanistic causation.
3. Notable Patterns and Outliers
The most striking feature is the hard floor of Y=0 for all X ~35,000, which appears across dozens of points (27983, 35437, 60981, 96467, 105920, 118670, etc.) — this looks like a structural break, possibly a data-recording artifact (e.g., missing/null-filled values) rather than a true economic collapse. Below that threshold, Y behaves as a saturating/logarithmic function of X: rapid growth at very low X, flattening near 55–70 as X approaches the tens of thousands. This log-like curve plus a cliff-drop suggests two distinct regimes in the data rather than one continuous relationship.
4. Confounding Factors and Caveats
Given the axis labels are swapped/mislabeled in the metadata (X is called "S&P 500... Real Dividend" but described as Bitcoin price data, and vice versa for Y), there is likely a data-pipeline or column-mapping error confusing interpretation. Both series are time-indexed (2010–2026) and non-stationary, financial time series — raw correlation between two trending series is often spurious (a classic case for detrending or using returns instead of levels). The Y=0 block for high X could reflect early Bitcoin-history zero/missing entries or a placeholder value rather than real S&P dividend data hitting zero, which would artificially inflate the negative correlation.
5. Suggested Next Steps
First, verify and correct the column/axis labeling to ensure X and Y are correctly identified before drawing economic conclusions. Second, filter or flag the Y=0 cluster to determine if it represents true values or missing-data placeholders — rerun correlation excluding these points to see if the relationship changes sign or shape. Third, since both series trend over time, analyze log-returns or first-differences instead of levels to test for genuine co-movement versus shared trend artifacts. Finally, given the significant Granger result, consider a formal lagged regression or VAR model to explore the 4-period predictive relationship more rigorously, ideally after resolving the data-quality issues above.
X dataset: Bitcoin Historical Price USD – All-Time Series (Habrador)
Y dataset: S&P 500 Monthly Data Since 1871 – Shiller/datahub.io
Part of experiment: Bitcoin - Bitcoin Historical Price USD – All-Time Series (Habrador) vs S&P 500 Monthly Data Since 1871 – Shiller/datahub.io