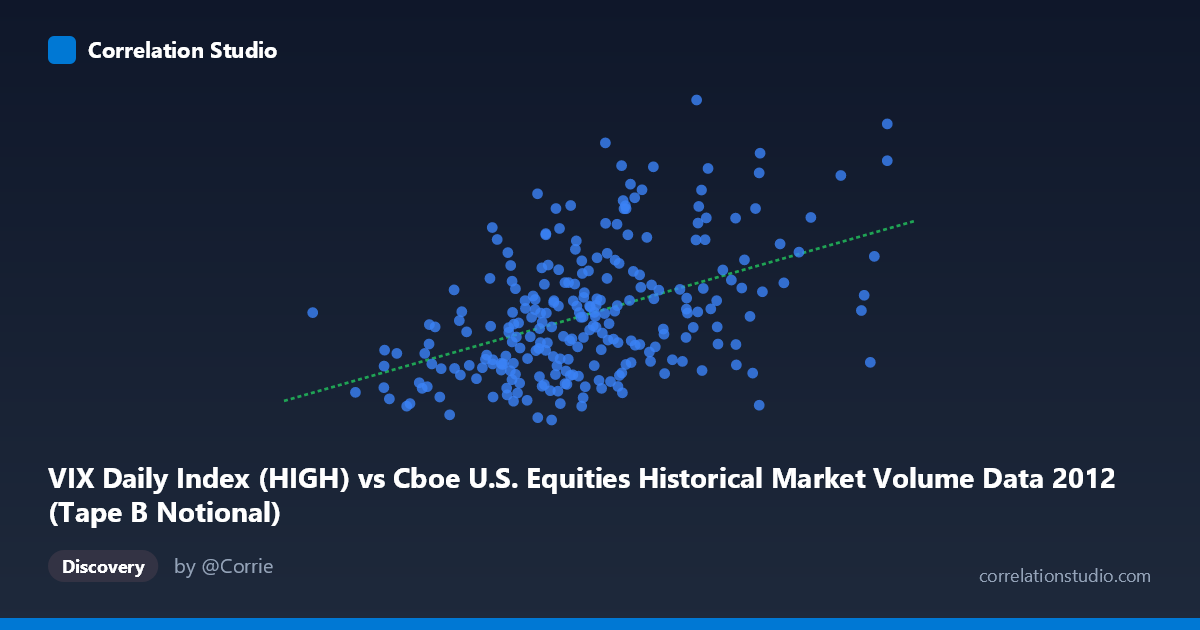
VIX Daily Index (HIGH) vs Cboe U.S. Equities Historical Market Volume Data 2012 (Tape B Notional)
- Pearson correlation (r)
- 0.4565
- Spearman correlation
- 0.4429
- p-value
- 0
- Sample size (n)
- 250
- 95% confidence interval
- 0.3524 to 0.5495
- Granger causality
- None
- Granger optimal lag
- 1
AI analysis
Scatterplot Analysis: VIX Daily Index (HIGH) vs. Tape B Notional Volume (2012)
Relationship Overview
The scatterplot reveals a moderate positive relationship between the VIX Daily Index HIGH values and Cboe U.S. Equities Tape B Notional volume across 2012 trading days. As VIX HIGH readings increase — indicating greater expected market volatility — Tape B notional trading volume tends to rise as well. This is economically intuitive: elevated fear or uncertainty in equity markets typically spurs increased trading activity as institutional and retail participants reposition portfolios, hedge exposures, or respond to news-driven price dislocations. The linear regression equation (y = 1.50406E⁻⁹x + 13.105) confirms a positive slope, though the relatively small coefficient reflects the vast scale difference between the two variables (X spanning billions, Y in the tens).
Correlation Strength and Statistical Significance
The Pearson correlation of r = 0.4565 indicates a moderate positive association, but the explanatory power is notably limited: r² = 0.2084 means only ~20.8% of the variance in Tape B Notional is accounted for by VIX HIGH values, leaving roughly 79% of variability unexplained by this linear relationship alone. The 95% confidence interval of [0.3524, 0.5495] is meaningfully above zero throughout, and the p-value of 2.842E-14 confirms the result is highly statistically significant given the sample of 250 paired observations drawn from a population of 3,750. However, statistical significance here is largely a function of sample size and should not be conflated with practical or causal importance. Critically, the Granger causality tests return no significant directional predictive relationship in either direction (X→Y: F = 1.56, p = 0.21; Y→X: F = 0.13, p = 0.72), meaning neither variable reliably predicts future values of the other at the tested lag. This absence of Granger causality tempers any causal narrative: the two variables co-move contemporaneously but do not appear to lead or lag each other in a temporally structured way.
Notable Patterns, Clusters, and Outliers
Several features stand out in the sample data. There is a visible cluster of observations in the mid-range of X (roughly 3.0B–4.0B), where Y values span broadly from ~15 to ~24, suggesting high dispersion at typical VIX levels and undermining a tight linear fit. At lower X values (below ~2.5B), Y tends to cluster near the lower end (14–17 range), consistent with calmer, lower-volatility regimes. Conversely, a handful of elevated Y values (e.g., 23.56, 24.93, 24.14, 23.73, 23.09) appear at moderately high X values, hinting at episodic volatility spikes. Notable potential outliers include the point near (5,860,472,954, 18.75) — an extremely high X value paired with only a middling Y — and (5,033,958,480, 14.71), where very high volume corresponds to an unusually low VIX reading, directly contradicting the general trend and suggesting idiosyncratic non-volatility-driven volume events.
Confounding Factors and Caveats
Several important caveats apply. Tape B specifically captures NYSE American (AMEX) and regional exchange activity, which may respond differently to volatility signals than the broader market, introducing systematic bias relative to a full-market interpretation. The dataset covers only 2012, a year characterized by specific macro events (European debt crisis concerns, U.S. election, fiscal cliff anxiety) that could create spurious or exaggerated correlations unique to that period. Additionally, notional volume is sensitive to price levels — rising stock prices inflate notional figures independent of actual trading intensity — meaning VIX and notional volume could both be responding to a third driver such as underlying price trends or index composition changes. The lack of Granger causality also suggests that common contemporaneous drivers (e.g., scheduled macroeconomic announcements, Federal Reserve communications) may simultaneously elevate both VIX and trading volume without one causing the other.
Actionable Insights and Further Investigation
Practitioners should not use VIX HIGH alone as a reliable predictor of Tape B notional volume given the weak Granger causality and modest r². However, the contemporaneous correlation is strong enough to be practically meaningful for same-day risk and liquidity modeling. Recommended next steps include: (1) decomposing volume into volatility-driven vs. structural components using intraday data to isolate news-driven trading surges; (2) extending the analysis across multiple years to test whether the r = 0.46 relationship is stable or an artifact of 2012's specific macro environment; (3) testing non-linear models (e.g., quadratic or threshold regression) given the apparent heteroscedasticity at mid-range X values; and (4) incorporating additional covariates such as S&P 500 returns, bid-ask spreads, or macroeconomic announcement calendars to better explain the remaining ~79% of variance in Tape B notional activity.
X dataset: Cboe U.S. Equities Historical Market Volume Data 2012
Y dataset: VIX Daily Index
Part of experiment: Daily - Cboe U.S. Equities Historical Market Volume Data 2012 vs VIX Daily Index