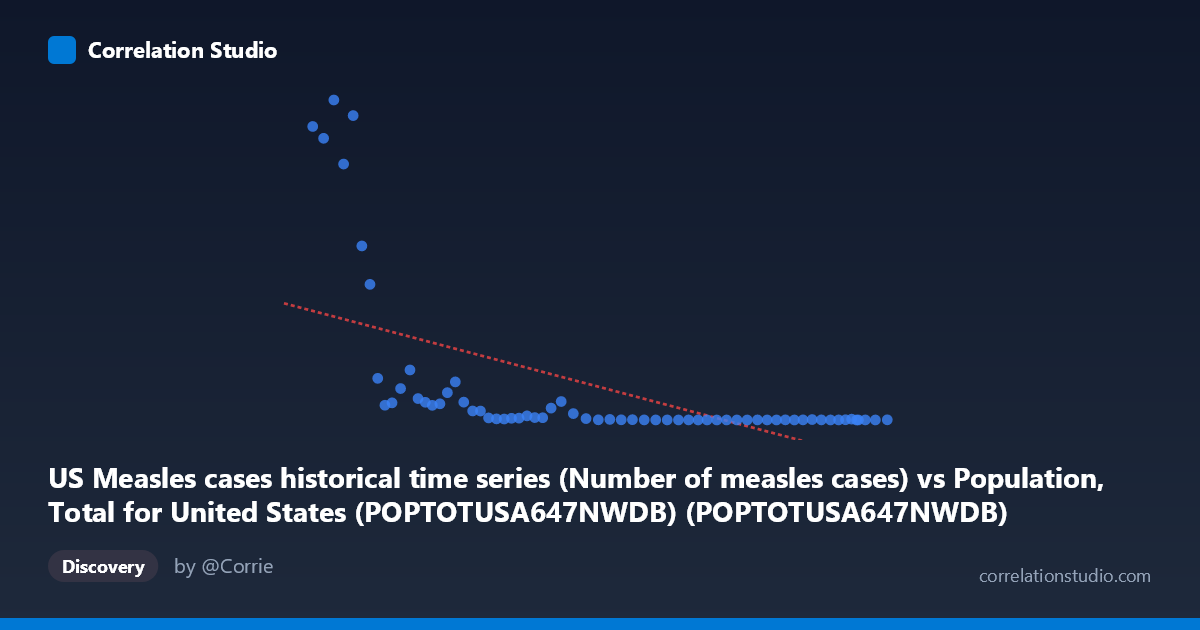
US Measles cases historical time series (Number of measles cases) vs Population, Total for United States (POPTOTUSA647NWDB) (POPTOTUSA647NWDB)
- Pearson correlation (r)
- -0.577
- Spearman correlation
- -0.8712
- p-value
- 0
- Sample size (n)
- 65
- 95% confidence interval
- -0.7196 to -0.3876
- Granger causality
- None
- Granger optimal lag
- 10
AI analysis
Analysis of US Population vs. Measles Cases (1960–2024)
1. What the Visualization Reveals
The scatterplot displays a striking inverse relationship between US total population (X-axis, ranging from ~181 million to ~340 million) and annual measles cases (Y-axis, ranging from 13 to ~481,530). As the US population grew over the decades from 1960 to 2024, reported measles cases dropped dramatically — from hundreds of thousands annually in the early 1960s to near-zero in recent decades. The data points form a steep, curved descent concentrated along the left side of the plot (lower population values, higher case counts), with a dense cluster of very low case counts bunched along the bottom right (higher population values). This visual pattern immediately suggests a strong temporal confound: both variables are primarily expressions of time, not of each other.
2. Correlation Strength, Direction, and Causality
The Pearson correlation is r = -0.577, indicating a moderate-to-strong negative association, with r² = 0.333 meaning that roughly 33% of the variance in measles cases is statistically explained by population size. The 95% confidence interval of [-0.72, -0.39] is entirely negative and does not cross zero, and the p-value of 4.88 × 10⁻⁷ confirms this association is highly statistically significant — effectively ruling out chance as an explanation for the observed correlation. However, the note that Spearman ρ exceeds Pearson r is critical: it signals that the true relationship is non-linear (likely logarithmic or exponential decay), meaning the linear model understates the sharpness of the decline and the 33% explained variance is a conservative, imprecise summary of the actual pattern. Most importantly, Granger causality analysis finds no significant predictive direction in either direction (X→Y: F=1.62, p=0.144; Y→X: F=1.25, p=0.295), meaning population size does not temporally predict future measles cases and vice versa. This is a decisive indicator that the correlation is spurious rather than mechanistic.
3. Notable Patterns, Clusters, and Outliers
Several features stand out. First, there is a prominent high-leverage cluster in the lower-left quadrant: roughly 8–10 data points corresponding to the early 1960s (population ~180–200 million) carry extremely high measles counts (191,000–481,530 cases), including what appears to be a pre-vaccine peak. These points exert disproportionate influence on the regression slope. Second, the vast majority of points — representing the 1980s onward — are compressed near zero on the Y-axis regardless of population size, forming a near-horizontal floor. Third, there are a few moderate outliers in the 200–260 million population range with case counts in the 10,000–100,000 range, likely corresponding to the pre-elimination era of the late 1960s–early 1980s and the 1989–1991 resurgence. The sharp structural break between high-case and low-case eras suggests the data is better described by a step-function or exponential decay model than a linear one.
4. Confounding Factors and Caveats
The dominant confound here is time itself. Both variables are annual time series: population grows monotonically with time, while measles cases collapsed due to vaccine introduction (1963), the two-dose MMR schedule (1989), and declaration of measles elimination (2000) — all policy and medical interventions entirely unrelated to population size. The correlation is therefore a classic spurious correlation driven by shared temporal trends, not a causal link. Additional caveats include: (a) reporting and surveillance changes over six decades affect case count validity; (b) herd immunity dynamics mean the relationship between population size and disease transmission is non-linear and threshold-dependent; (c) recent small outbreaks (2019: ~1,282 cases) create visible noise in the lower-right cluster despite high population, reflecting localized vaccination gaps rather than population-level dynamics. The dataset also mixes pre- and post-elimination eras with fundamentally different epidemiological regimes, making a single regression model statistically misleading.
5. Actionable Insights and Further Investigation
Given the spurious nature of this correlation, the most productive next steps would be: (1) Replace population as X-axis with vaccination coverage rates (e.g., MMR 2-dose coverage % by year) to test a genuinely mechanistic hypothesis — this would likely explain far more variance and exhibit a real causal pathway; (2) Fit a segmented or piecewise regression model with breakpoints at 1963 (vaccine introduction) and ~1993 (post-resurgence) to properly capture the structural regime changes; (3) Conduct analysis separately by era (pre-vaccine, vaccine era, elimination era, post-elimination) to avoid conflating epidemiologically distinct periods; (4) Incorporate international importation data and community vaccination exemption rates to explain the small but notable post-2000 outbreaks; and (5) Apply a logarithmic transformation to the Y-axis to better model the exponential decay structure and improve regression fit, since the Spearman Pearson signal explicitly calls for this. The central takeaway is that population growth did not reduce measles — deliberate public health intervention did.
X dataset: Population, Total for United States (POPTOTUSA647NWDB)
Y dataset: US Measles cases historical time series
Part of experiment: Yearly - Population, Total for United States (POPTOTUSA647NWDB) vs US Measles cases historical time series