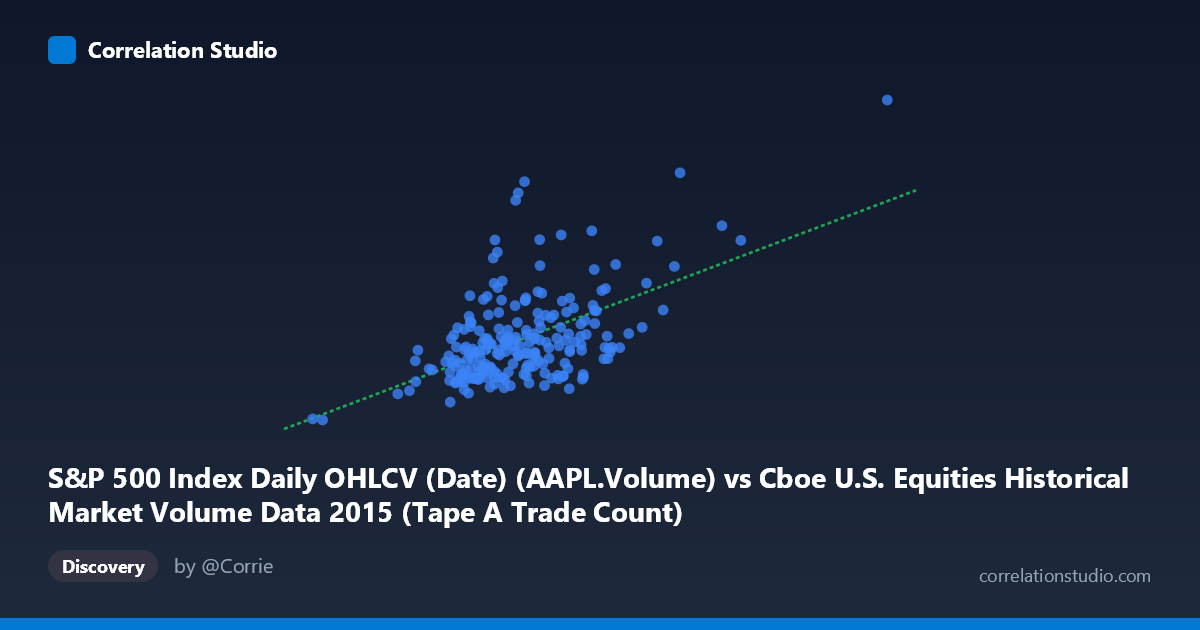
S&P 500 Index Daily OHLCV (Date) (AAPL.Volume) vs Cboe U.S. Equities Historical Market Volume Data 2015 (Tape A Trade Count)
- Pearson correlation (r)
- 0.5464
- Spearman correlation
- 0.4379
- p-value
- 0
- Sample size (n)
- 222
- 95% confidence interval
- 0.4469 to 0.6326
- Granger causality
- None
- Granger optimal lag
- 10
AI analysis
Scatterplot Analysis: AAPL Trading Volume vs. Cboe Tape A Trade Count (2015)
Relationship Overview
The scatterplot reveals a moderate positive relationship between Apple Inc.'s daily trading volume (S&P 500 OHLCV dataset) and the Cboe U.S. Equities Tape A Trade Count for 2015. The linear regression equation (y = 43.10x − 10,916,400) suggests that for each unit increase in AAPL volume, Tape A trade counts increase by approximately 43 trades. Visually, the data points show a general upward trend but with considerable scatter around the regression line, indicating that while the two variables move together to some degree, the relationship is far from deterministic. This makes intuitive sense: AAPL is one of the most heavily traded equities on U.S. markets, so elevated AAPL activity likely reflects broader market engagement, but many other securities and factors drive overall Tape A counts independently.
Correlation Strength and Statistical Significance
The Pearson correlation of r = 0.5464 indicates a moderate positive association, but the more telling metric is r² = 0.2985, meaning AAPL volume explains only about 29.9% of the variance in Tape A trade counts — leaving roughly 70% of variability unaccounted for by this relationship alone. The 95% confidence interval of [0.4469, 0.6326] is meaningfully above zero and relatively tight given the sample size of n = 222, lending confidence that the correlation is genuine rather than a statistical artifact. The p-value of effectively 0 confirms the relationship is highly statistically significant. However, Granger causality tests reveal no significant temporal predictive direction in either direction (X→Y: F = 1.29, p = 0.24; Y→X: F = 0.86, p = 0.57), meaning that past values of AAPL volume do not reliably forecast future Tape A trade counts, and vice versa, at the optimal 10-period lag. This critically distinguishes correlation from predictive utility — the variables co-move contemporaneously but neither leads the other in time.
Patterns, Clusters, and Outliers
Several notable features are visible in the scatterplot. The bulk of observations cluster in a moderate-density region roughly between X = 1,100,000–1,700,000 and Y = 25,000,000–75,000,000, suggesting typical market conditions during most of 2015. However, two prominent outliers stand out dramatically: the point at approximately (2,923,236; 162,206,300) and another near (2,247,816; 103,601,600), both sitting far above and to the right of the main cluster. These likely correspond to high-volatility market events — possibly the August 2015 flash crash or major earnings announcements — where both AAPL volume and overall market activity spiked simultaneously. A third observation near (616,505; 13,046,400) anchors the lower-left extreme. These outliers exert disproportionate leverage on the regression line and correlation coefficient, and the relationship may appear weaker or differently shaped if they are excluded. There is also a suggestion of heteroscedasticity, where variance in Y increases at higher X values, indicating the linear model may underfit at extremes.
Confounding Factors and Caveats
Several important caveats temper interpretation. First, spurious co-movement is likely: both variables are fundamentally driven by broader market conditions (volatility regimes, macroeconomic news, institutional activity), meaning their correlation may largely reflect a shared response to a third driver rather than any direct linkage. Second, the dataset axis labeling appears inverted — the X-axis is labeled as AAPL volume from a Cboe dataset, while the Y-axis references Tape A trade count from the S&P 500 OHLCV dataset, which warrants verification of data pipeline integrity before drawing firm conclusions. Third, the time period (February–December 2015) includes the August 2015 volatility event, which could artificially inflate the correlation; a full multi-year analysis would provide more robust estimates. Finally, the r² of ~30% serves as a reminder that correlation magnitude alone can be misleading — a statistically significant but practically limited relationship should not be over-interpreted as actionable.
Actionable Insights and Further Investigation
For practitioners, the moderate correlation and absent Granger causality suggest that AAPL volume alone is insufficient as a predictive signal for overall market trade activity. However, it may serve as a useful contemporaneous indicator within ensemble models that incorporate additional high-volume equities or market-wide volatility measures (e.g., VIX). Further investigation should include: (1) testing whether removing the two extreme outliers substantially alters r² and the regression slope; (2) examining whether the correlation strengthens during high-volatility sub-periods versus calm periods to assess regime dependency; (3) expanding the analysis to include other large-cap OHLCV series (MSFT, AMZN) to see if a composite volume index better explains Tape A trade counts; and (4) applying a non-linear or quantile regression framework to address the apparent heteroscedasticity. Confirming the axis-to-dataset mapping is also a necessary first step before any production use of this analysis.
X dataset: Cboe U.S. Equities Historical Market Volume Data 2015
Y dataset: S&P 500 Index Daily OHLCV (Date)
Part of experiment: Daily - Cboe U.S. Equities Historical Market Volume Data 2015 vs S&P 500 Index Daily OHLCV (Date)