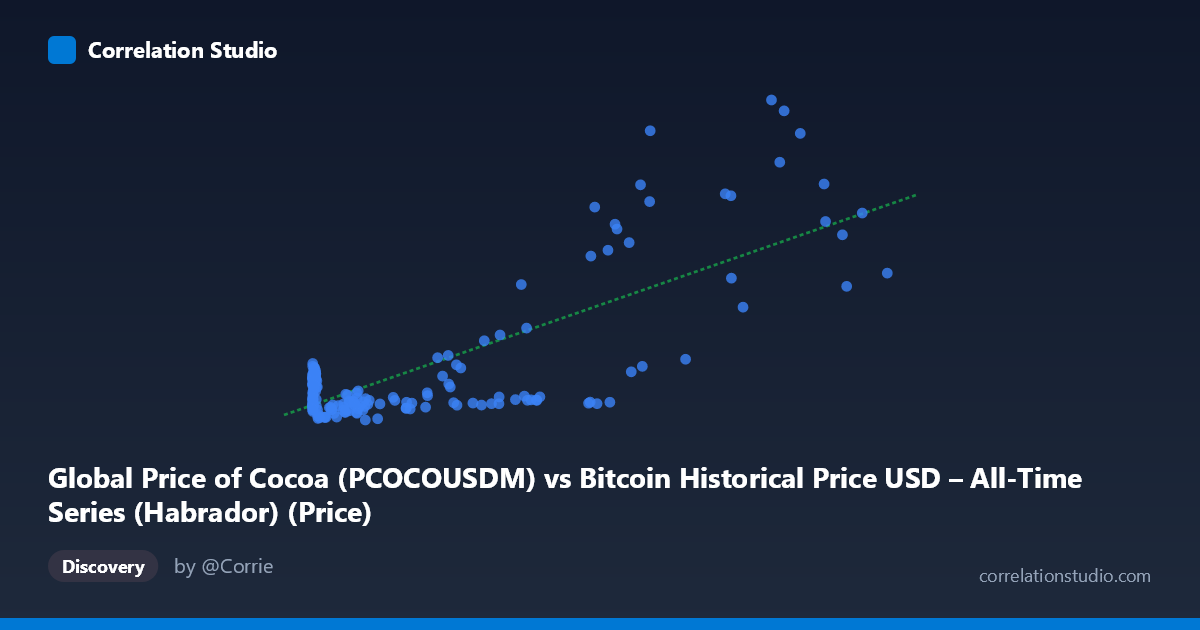
Global Price of Cocoa (PCOCOUSDM) vs Bitcoin Historical Price USD – All-Time Series (Habrador) (Price)
- Pearson correlation (r)
- 0.7716
- Spearman correlation
- 0.2329
- p-value
- 0
- Sample size (n)
- 189
- 95% confidence interval
- 0.7067 to 0.8236
- Granger causality
- None
- Granger optimal lag
- 10
AI analysis
Analysis: Cocoa Price vs. Bitcoin Price Relationship
1. What the Visualization Reveals
The scatterplot displays a positive, moderately strong association between cocoa prices (X-axis, ranging from near $0 to $118,670/metric ton — an unusually wide range suggesting possible unit or scaling artifacts) and Bitcoin prices (Y-axis, $1,918–$10,710). The data shows a clear upward-sloping pattern, but with substantial dispersion, particularly at higher X-values. Most points cluster in the low-X region (under $10,000), where Y-values compress into a narrow band (~$2,000–3,000), while a smaller number of high-X points (above $60,000) show much greater Y variability, ranging from ~$2,300 to over $10,700.
2. Strength, Direction, and Statistical Confidence
The correlation coefficient (r = 0.776) indicates a fairly strong positive linear relationship, with r² = 0.603 meaning approximately 60% of the variance in Y is statistically explained by X — a substantial but incomplete share, leaving 40% attributable to other factors or noise. The 95% CI [0.712, 0.828] is reasonably tight given the p-value of ~0, indicating this correlation is highly unlikely to be a product of chance in this sample. However, correlation does not imply causal direction, and the Granger causality tests confirm this: neither X→Y nor Y→X shows significant predictive power (p = 0.41 and p = 0.36, respectively) even at an optimal lag of 10 periods. This is a critical caveat — despite the strong contemporaneous correlation, neither variable helps forecast the other over time, suggesting the relationship may be driven by a shared external trend (e.g., both assets appreciating during the same macro period) rather than direct interaction.
3. Notable Patterns and Outliers
The data exhibits a distinct heteroscedastic fan shape: variance in Y increases dramatically as X increases. At low cocoa prices, Bitcoin values are tightly clustered near $2,000–3,000, but at high cocoa prices ($60,000), Bitcoin prices scatter widely from $2,300 to $10,700 — this is not a clean linear cloud but suggests two or more regimes. Notably, several points at very high X (e.g., 97,365 → 10,412; 105,620 → 8,402) coexist with points at similarly high X but low Y (e.g., 58,724 → 2,366; 56,973 → 2,379), implying the relationship may be time-dependent (with X and Y both trending upward independently over the 2010–2026 period) rather than causally linked at each observation.
4. Confounding Factors and Caveats
The most likely confound is a shared time trend: since this spans 2010–2026, both cocoa and Bitcoin prices may have risen due to independent macro factors (inflation, USD depreciation, commodity supercycles, crypto adoption cycles) rather than any genuine economic link between cocoa markets and cryptocurrency. This is a classic spurious correlation risk in time-series data with trending, non-stationary variables. The lack of Granger causality reinforces that this is likely a coincidental co-trending relationship rather than a mechanistic one. Additionally, the extreme X-range (0.06 to 118,670) raises questions about data quality, units, or possible mixing of different price scales/currencies within the cocoa series.
5. Actionable Insights
Given the non-stationarity risk, analysts should detrend or first-difference both series and re-test correlation to check if the relationship holds on stationary data — this would clarify whether the 0.776 correlation is genuine or an artifact of shared trends. Further investigation should also segment the data by time period to check if the correlation is driven by a specific era (e.g., only strong during 2020–2024 crypto/commodity bull markets) rather than being stable throughout. Given the Granger results, this correlation should not be used for predictive trading strategies between cocoa and Bitcoin; instead, treat both as potentially correlated but independently-driven assets, and investigate common third factors (e.g., USD index, global liquidity/inflation measures) that might jointly explain both price trajectories.
X dataset: Bitcoin Historical Price USD – All-Time Series (Habrador)
Y dataset: Global Price of Cocoa
Part of experiment: Bitcoin - Bitcoin Historical Price USD – All-Time Series (Habrador) vs Global Price of Cocoa