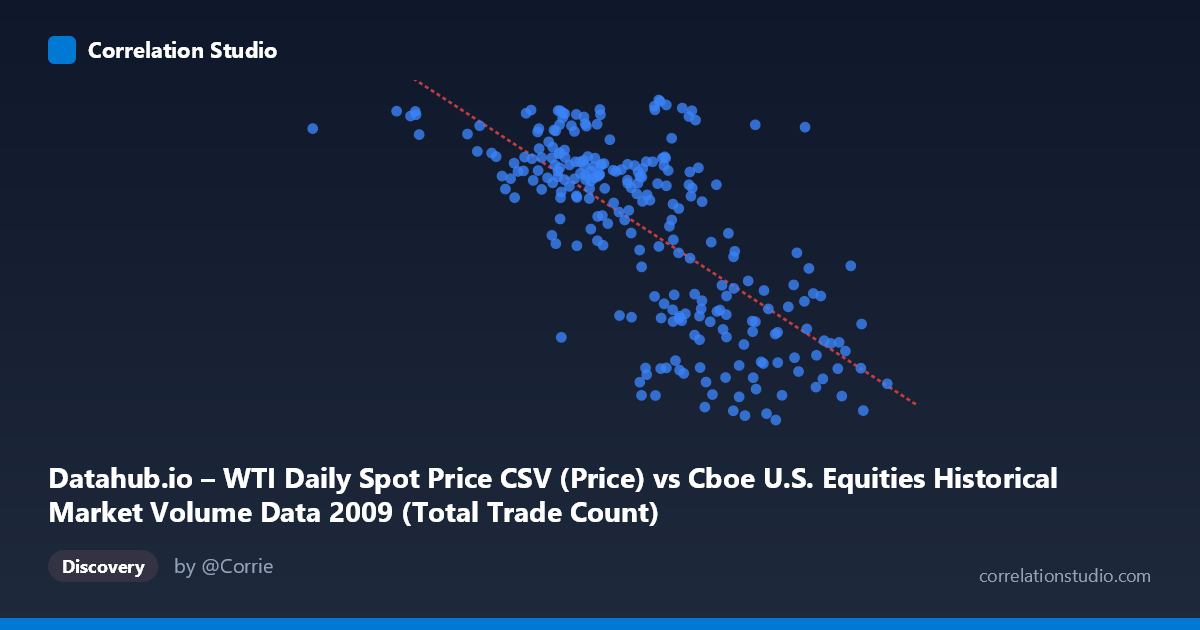
Datahub.io – WTI Daily Spot Price CSV (Price) vs Cboe U.S. Equities Historical Market Volume Data 2009 (Total Trade Count)
- Pearson correlation (r)
- -0.6983
- Spearman correlation
- -0.6848
- p-value
- 0
- Sample size (n)
- 252
- 95% confidence interval
- -0.7566 to -0.6291
- Granger causality
- None
- Granger optimal lag
- 1
AI analysis
Scatterplot Analysis: WTI Oil Price vs. U.S. Equity Market Trade Count (2009)
Relationship Overview
The scatterplot reveals a moderate-to-strong negative relationship between WTI daily spot oil prices (X-axis) and the total trade count on U.S. equity markets (Y-axis) throughout 2009. As oil prices increase, the number of equity trades tends to decline, and vice versa. The linear regression equation (y = -1.56118E⁻⁰⁵x + 103.587) captures this downward slope visually, with the cloud of points trending from the upper-left to the lower-right of the chart. This inverse pattern is economically intuitive in the context of 2009's post-financial-crisis environment, where low oil prices coincided with heightened market anxiety and frenetic trading activity, while rising oil prices later in the year accompanied a calmer, recovering market.
Correlation Strength and Statistical Significance
The Pearson correlation coefficient of r = -0.6983 indicates a moderately strong negative association. More concretely, the R² of 0.4877 means that approximately 48.8% of the variance in trade count is explained by variation in WTI oil prices — a substantial but incomplete explanatory share, leaving roughly half of the variance attributable to other factors. The 95% confidence interval of [-0.7566, -0.6291] is relatively narrow and does not include zero, and the p-value is effectively 0, confirming that this correlation is statistically robust and highly unlikely to be a chance artifact given the sample of 252 paired observations drawn from a population of 3,232. However, the Granger causality tests reveal no significant temporal predictive direction in either direction (X→Y: F = 0.603, p = 0.438; Y→X: F = 1.571, p = 0.211), meaning that despite the strong contemporaneous correlation, neither variable reliably predicts the other one period ahead. This is a critical caveat: the correlation is real, but it does not imply a leading/lagging causal mechanism at the daily frequency tested.
Notable Patterns, Clusters, and Outliers
Several structural features stand out in the data. There appears to be a clustering of high trade counts (Y 70) concentrated at lower X values (roughly WTI prices below ~$2.5M in the encoded units, corresponding to lower absolute price levels), consistent with the early-2009 period when oil was cheap and market volatility drove extreme trading volumes. Conversely, points cluster more tightly at lower trade counts (Y ~35–55) as X values rise above ~$3M, suggesting that as oil recovered in mid-to-late 2009, trading activity compressed. A few notable outliers are visible — for instance, the point at approximately (629,671, 76.83) sits far to the left of the main cluster, suggesting an anomalously low oil price day with still-elevated trade counts, potentially reflecting early January 2009 market dynamics. Similarly, some high-X points (e.g., ~4.1M range) show very low Y values (~39), forming a sparse right-side tail. The relationship also shows some non-linearity, with variance in trade counts being considerably wider at lower oil prices, suggesting heteroscedasticity.
Confounding Factors and Interpretive Caveats
This correlation almost certainly reflects shared temporal trends rather than a direct causal mechanism. Both variables were strongly influenced by the 2008–2009 global financial crisis recovery arc: oil prices rose from post-crash lows in early 2009 toward year-end recovery, while equity trading volumes were highest during peak uncertainty and declined as markets stabilized. This means a common third driver — macroeconomic recovery and declining volatility (e.g., VIX) — likely explains much of the observed relationship. Additionally, the dataset note labels appear to be swapped (X-axis is described as WTI price but labeled as a Cboe volume dataset, and vice versa), which warrants verification before drawing firm conclusions. The encoded X values (629K–4.1M range) do not correspond to typical WTI price ranges in USD/barrel, suggesting these may be scaled, transformed, or composite values. Finally, the optimal lag of only 1 period may be too short to detect meaningful lagged relationships at weekly or monthly horizons.
Actionable Insights and Further Investigation
Given the strong contemporaneous correlation but absent Granger causality, the most productive next steps would include: (1) testing Granger causality at longer lags (5-day, 20-day) to capture weekly or monthly predictive dynamics; (2) introducing a volatility measure such as VIX as a control variable to disentangle the confounding effect of market stress; (3) verifying and correcting the apparent axis label discrepancy to ensure variables are correctly identified; (4) applying a regime-change analysis (e.g., Chow test or Markov-switching model) to determine whether the relationship differs between the crisis and recovery phases of 2009; and (5) examining whether this correlation persists in other years or is specific to the unique dynamics of 2009's recovery, which would clarify whether this is a stable structural relationship or a historically contingent artifact.
X dataset: Cboe U.S. Equities Historical Market Volume Data 2009
Y dataset: Datahub.io – WTI Daily Spot Price CSV
Part of experiment: Daily - Cboe U.S. Equities Historical Market Volume Data 2009 vs Datahub.io – WTI Daily Spot Price CSV