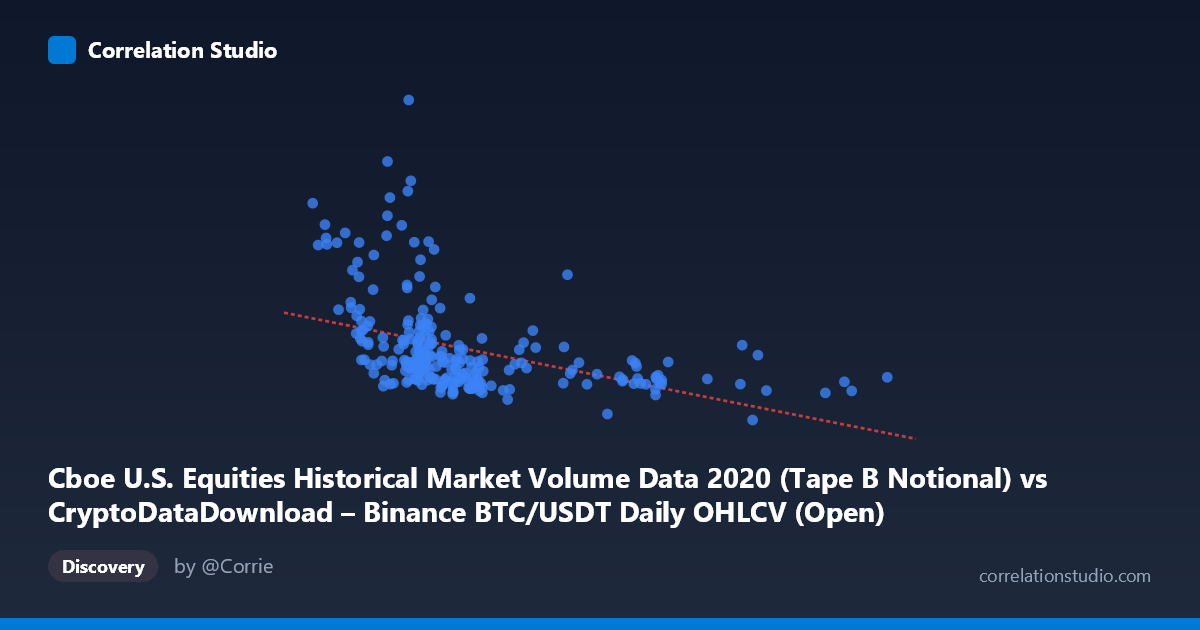
Cboe U.S. Equities Historical Market Volume Data 2020 (Tape B Notional) vs CryptoDataDownload – Binance BTC/USDT Daily OHLCV (Open)
- Pearson correlation (r)
- -0.4189
- Spearman correlation
- -0.5871
- p-value
- 0
- Sample size (n)
- 253
- 95% confidence interval
- -0.5156 to -0.3117
- Granger causality
- None
- Granger optimal lag
- 10
AI analysis
Analysis: Cboe Equities Volume vs. Binance BTC/USDT Open Price (2020)
1. What the Visualization Reveals
The scatterplot shows a moderate negative relationship between U.S. equities market volume (X) and Bitcoin's opening price (Y). Most data points cluster tightly in the lower-left quadrant — X values between 7,000–12,000 and Y values between 4–7 billion — while a smaller number of high-leverage points extend the range dramatically, particularly in the Y direction (several points exceed 10-21 billion) and X direction (a handful of points beyond 15,000, reaching to nearly 29,000). This creates a dense core cluster with a sparse, elongated tail rather than a smooth linear spread.
2. Strength, Direction, and Uncertainty
The Pearson correlation of r = -0.419 indicates a moderate negative linear association, but r² = 0.176 tells the more important story: only about 17.5% of the variance in one variable is explained by the other, leaving over 82% attributable to other factors or noise. The 95% CI [-0.516, -0.312] is reasonably tight and excludes zero, and the p-value (3.59e-12) confirms this relationship is highly unlikely to be due to chance in this sample. However, statistical significance should not be conflated with practical strength — this is a weak-to-moderate relationship, not a tight coupling. Critically, the Granger causality tests show no significant predictive direction (both p 0.36), meaning neither variable's past values reliably forecast the other's future values at daily granularity. This strongly suggests the correlation is contemporaneous/coincidental (likely driven by a shared macro backdrop — 2020's COVID volatility — rather than one market mechanically driving the other).
3. Notable Patterns and Outliers
Several features stand out: - A dense core cluster (X: 7,000–12,000, Y: 4–7B) represents "normal" trading days and dominates the sample. - Vertical outliers at low X values (e.g., X≈8,800 with Y≈21.2B; X≈4,800 with Y≈15B; X≈7,895 with Y≈13B) likely correspond to the March 2020 COVID crash period, when Bitcoin's price surged in specific windows while equity volume was comparatively lower — these points may be exerting outsized influence on the negative slope. - A secondary horizontal cluster at higher X values (15,000–29,000) with comparatively low, stable Y (~4B) suggests periods of elevated equity trading volume (possibly pandemic-driven trading surges) coinciding with lower BTC prices, reinforcing the negative trend but from a different regime. - The Spearman ρ Pearson r note is important: it implies the true relationship may be monotonic but non-linear (e.g., logarithmic or threshold-based), meaning the linear regression line (y = -286,529x + 9.47B) likely understates the relationship's true monotonic strength.
4. Confounding Factors and Caveats
This pairing is unusual: comparing a notional dollar volume metric (equities) to a price level metric (BTC) mixes scale and units in ways that complicate interpretation. Both series were likely driven by a common confounder — COVID-19 market turmoil — which caused simultaneous spikes in equity trading activity (volatility-driven volume) and BTC price swings, without one causing the other. Additionally, 2020 was a non-stationary year for both series (structural breaks around March), which can artificially inflate or distort correlation estimates calculated over the full period. The small paired sample (n=253) relative to the full dataset (N=3,212) also raises questions about how representative this subsample is.
5. Actionable Insights and Next Steps
- Do not treat this as a tradable signal — the lack of Granger causality and modest r² indicate this correlation has little predictive/causal value for trading strategies. - Segment by regime: Split the data into pre-COVID-crash, crash, and recovery periods to see if the correlation is driven entirely by the March 2020 anomaly (test by excluding Feb–Apr 2020 and re-running correlation). - Test non-linear models: Given Spearman ρ Pearson r, fit log-log or polynomial regressions and compare R² improvement. - Control for a common macro factor: Introduce a volatility index (e.g., VIX) or a COVID-stringency index as a covariate to test whether the BTC–equities volume link disappears once shared macro shocks are accounted for. - Use returns, not levels: Since BTC price and equity volume are both non-stationary, consider correlating daily % changes or log-differences instead of raw levels to avoid spurious correlation from trends.
X dataset: CryptoDataDownload – Binance BTC/USDT Daily OHLCV
Y dataset: Cboe U.S. Equities Historical Market Volume Data 2020
Part of experiment: Bitcoin - CryptoDataDownload – Binance BTC/USDT Daily OHLCV vs Cboe U.S. Equities Historical Market Volume Data 2020