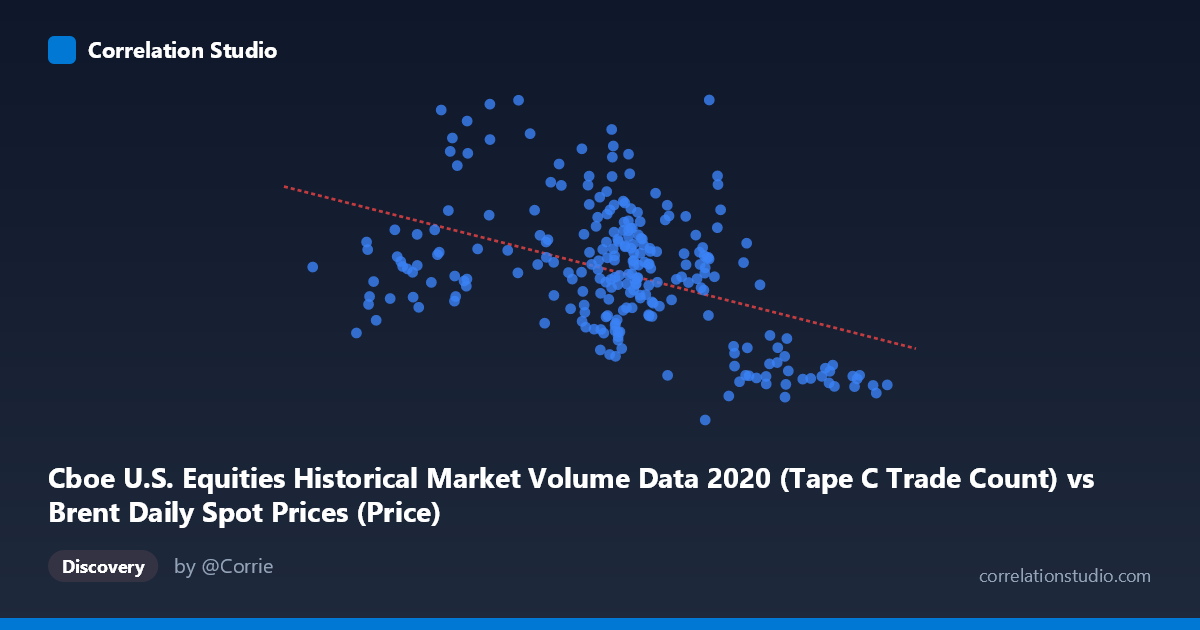
Cboe U.S. Equities Historical Market Volume Data 2020 (Tape C Trade Count) vs Brent Daily Spot Prices (Price)
- Pearson correlation (r)
- -0.4487
- Spearman correlation
- -0.3842
- p-value
- 0
- Sample size (n)
- 250
- 95% confidence interval
- -0.5426 to -0.3438
- Granger causality
- None
- Granger optimal lag
- 10
AI analysis
Scatterplot Analysis: Cboe Tape C Trade Count vs. Brent Crude Oil Spot Price (2020)
Relationship Overview
The scatterplot reveals a moderate negative relationship between the Cboe U.S. Equities Tape C trade count (X) and the daily Brent crude oil spot price in USD per barrel (Y) across 2020. As equity trade counts increase, Brent crude prices tend to decline, and vice versa. This inverse pattern is visually apparent in the data distribution, with higher trade counts clustering around lower oil prices and lower trade counts associating with a broader, higher range of oil prices. The linear regression equation (y = -10,569.7x + 1,810,740) quantifies this: each unit increase in trade count is associated with a decrease of roughly $10,570 in the Brent price index value, though the practical interpretation depends heavily on the scaling of the trade count variable.
Correlation Strength and Statistical Significance
The Pearson correlation of r = -0.4487 indicates a moderate negative association, but the explanatory power is notably limited: r² = 0.2014, meaning only about 20.1% of the variance in Brent crude prices is explained by equity trade count. The remaining ~80% of price variation is attributable to other factors entirely. The 95% confidence interval of [-0.5426, -0.3438] is meaningfully away from zero, and the p-value of 8.638×10⁻¹⁴ confirms the correlation is highly statistically significant given the large population (N = 4,254). However, statistical significance here is partly a function of sample size — significance does not imply strong practical predictive power. Critically, the Granger causality tests find no significant directional predictive relationship in either direction (X→Y: F = 1.24, p = 0.27; Y→X: F = 0.90, p = 0.53), meaning that despite the contemporaneous correlation, neither variable reliably predicts the future values of the other at the optimal 10-period lag. This substantially limits any causal or forecasting interpretation.
Notable Patterns, Clusters, and Outliers
Several features stand out in the sample data. There is a visible cluster of points with mid-range trade counts (~40–50) spanning a very wide range of Y values (roughly 1,000,000 to 1,924,000), suggesting high variability in Brent prices even when trade counts are similar — consistent with the weak r². A distinct lower-right cluster appears for higher trade counts (57–67 range), where Brent prices compress toward lower values (~903,000–914,000), suggesting that extreme equity market activity episodes coincide with depressed oil prices. Points like (67.05, 903,229), (62.11, 905,149), and (57.35, 914,029) form a tight, low-price grouping that likely corresponds to the March–April 2020 COVID-19 market shock, when equity volumes surged amid panic selling and oil prices collapsed simultaneously. Conversely, some low-X observations (e.g., (14.85, 1,503,294) and (18.11, 1,439,065)) show relatively high oil prices with low trade volumes, consistent with calmer late-2019/early-2020 or late-2020 market conditions. The relationship appears potentially non-linear or regime-driven rather than smoothly linear.
Confounding Factors and Caveats
The most significant caveat here is spurious correlation driven by a shared confounding event: the 2020 COVID-19 pandemic. The pandemic simultaneously caused historic equity market volatility (spiking trade counts) and a dramatic collapse in oil demand and prices. This single macro event could be the primary driver of the observed negative correlation, rather than any fundamental economic linkage between U.S. equity trading volume and Brent crude pricing. Additionally, the dataset label mismatch (X is described as coming from the "Brent Daily Spot Prices" dataset but is a Cboe trade count, and Y is from the "Cboe" dataset but is a Brent price) warrants data provenance verification before drawing conclusions. The correlation is also purely contemporaneous — the Granger analysis shows no lagged predictive structure — suggesting any observed co-movement is likely reactive to common external shocks rather than reflecting a directional market mechanism. Seasonal patterns, OPEC production decisions, USD strength, and macroeconomic sentiment are all confounders not captured here.
Actionable Insights and Further Investigation
Given that a single crisis year (2020) with an extreme exogenous shock is driving much of this correlation, analysts should replicate this analysis across multiple years (e.g., 2017–2023) to test whether the negative relationship persists in non-crisis environments. It would be valuable to segment the data by market regime (e.g., pre-COVID, crash period, recovery) to determine whether the correlation is regime-specific. Introducing additional control variables — VIX (market fear index), USD/EUR exchange rates, OPEC supply data, and equity sector breakdowns — could help isolate whether equity trading volume has any independent explanatory power over oil prices. Given the absence of Granger causality, building predictive models using trade count as a leading indicator for Brent prices is not recommended based on current evidence. A more fruitful direction may be exploring nonlinear or threshold models that can capture the apparent regime-switching behavior visible in the scatterplot.
X dataset: Brent Daily Spot Prices
Y dataset: Cboe U.S. Equities Historical Market Volume Data 2020
Part of experiment: Daily - Brent Daily Spot Prices vs Cboe U.S. Equities Historical Market Volume Data 2020