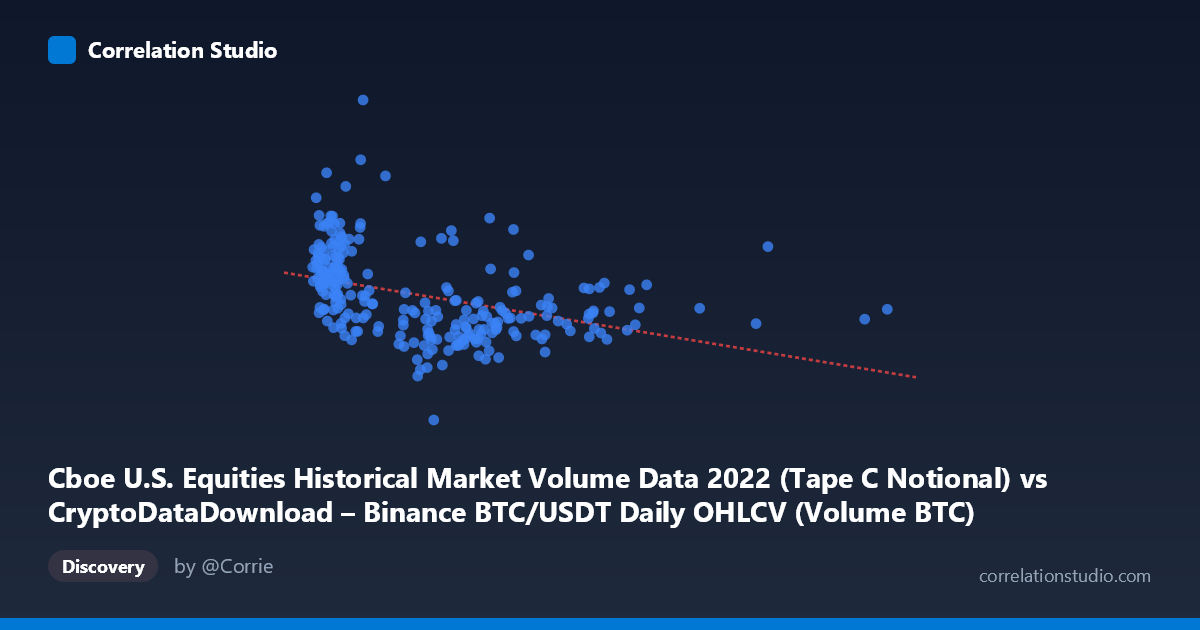
Cboe U.S. Equities Historical Market Volume Data 2022 (Tape C Notional) vs CryptoDataDownload – Binance BTC/USDT Daily OHLCV (Volume BTC)
- Pearson correlation (r)
- -0.4023
- Spearman correlation
- -0.5342
- p-value
- 0
- Sample size (n)
- 251
- 95% confidence interval
- -0.5011 to -0.2931
- Granger causality
- Y → X
- Granger optimal lag
- 10
- Time coverage
- 2022-01-03 to 2022-12-30
AI analysis
Analysis: BTC/USDT Volume (X) vs. Cboe U.S. Equities Notional Volume (Y)
1. What the Visualization Reveals
The scatterplot displays a modest negative relationship between Binance BTC/USDT trading volume and Cboe U.S. equities notional volume across 251 paired daily observations in 2022. Points cluster densely at lower X-values (below ~250,000) with a wide spread of Y-values, while higher X-values (300,000+) correspond to a narrower, lower-lying band of Y-values. This funnel-shaped distribution — high variance in Y at low X, compressed variance in Y at high X — is a visual signature that a simple linear fit only partially captures, consistent with the note that Spearman ρ exceeds Pearson r.
2. Strength, Direction, and Statistical Confidence
The correlation coefficient (r = -0.4023, r² = 0.162) indicates a weak-to-moderate negative linear relationship, meaning only about 16% of the variance in equities notional volume is explained by BTC/USDT volume (or vice versa in the regression framing). This leaves 84% of variance attributable to other factors, so while the relationship is statistically real, it has limited practical predictive power on its own. The 95% CI [-0.501, -0.293] is comfortably bounded away from zero, and the p-value (3.5×10⁻¹¹) confirms this negative association is highly unlikely to be due to chance given the sample. However, statistical significance here reflects a real but modest effect, not a strong dependency.
The Granger causality results add an important temporal dimension: Y (equities volume) Granger-causes X (crypto volume), not the reverse (F=2.039, p=0.031 vs. F=1.418, p=0.173 for the opposite direction), at an optimal lag of 10 periods (~2 trading weeks). This suggests that past equities market volume patterns have some predictive information for future BTC trading volume — plausibly through shared macro liquidity cycles, risk sentiment, or institutional capital rotation — rather than crypto activity driving equities volume.
3. Notable Patterns and Non-linearity
Several structural features stand out: - Clustering at low X: The majority of points sit below X=300,000, with Y values ranging widely from ~8B to ~22B, suggesting BTC volume alone doesn't tightly constrain equities volume in this regime. - Compression at high X: Above X≈300,000, Y values converge toward the 9-13B range, hinting at a possible inverse or saturating relationship rather than a strictly linear one. - High-Y outliers: Points like (88860.89, 22.09B) and (45408.01, 21.19B) sit well above the general trend, potentially representing days with unusual equities volume spikes independent of BTC activity. - The Spearman Pearson finding formally supports what the scatter suggests: a monotonic but curved (possibly logarithmic or power-law) relationship would likely fit better than the straight-line model, improving explained variance beyond 16.2%.
4. Confounding Factors and Caveats
This pairing is unusual in that it merges two structurally different markets (crypto trading volume vs. U.S. equities notional volume) that may share only indirect linkages — e.g., macro liquidity conditions, VIX/volatility regimes, Fed policy dates, or broad risk-on/risk-off sentiment in 2022 (a year marked by aggressive rate hikes and equity/crypto drawdowns). Both series are likely non-stationary and trend-driven over the year, which can inflate or distort correlation and Granger statistics if not differenced or detrended. Additionally, day-of-week effects, options expiration dates, and crypto-specific events (e.g., FTX collapse in November 2022) could independently drive spikes in either series, creating spurious correlation rather than a genuine causal link.
5. Suggested Next Steps
- Refit with non-linear models (log-log, polynomial, or spline regression) given the Spearman/Pearson divergence, to better capture the compression pattern at high X. - Detrend/difference both series (e.g., using daily % changes rather than levels) to control for shared macro trends and re-test correlation and Granger causality on stationary series. - Segment by 2022 sub-periods (e.g., pre/post FTX collapse, Fed meeting weeks) to check if the relationship is stable or driven by a few volatile clusters. - Investigate the 10-day lag mechanism economically — test whether equity volume surges (e.g., around options expiry or macro data releases) systematically precede BTC volume changes, and explore lagged cross-correlation plots for confirmation. - Treat this relationship as a weak leading indicator at best, not a standalone trading signal, given the low r² and modest effect size.
X dataset: CryptoDataDownload – Binance BTC/USDT Daily OHLCV
Y dataset: Cboe U.S. Equities Historical Market Volume Data 2022
Part of experiment: Bitcoin - CryptoDataDownload – Binance BTC/USDT Daily OHLCV vs Cboe U.S. Equities Historical Market Volume Data 2022