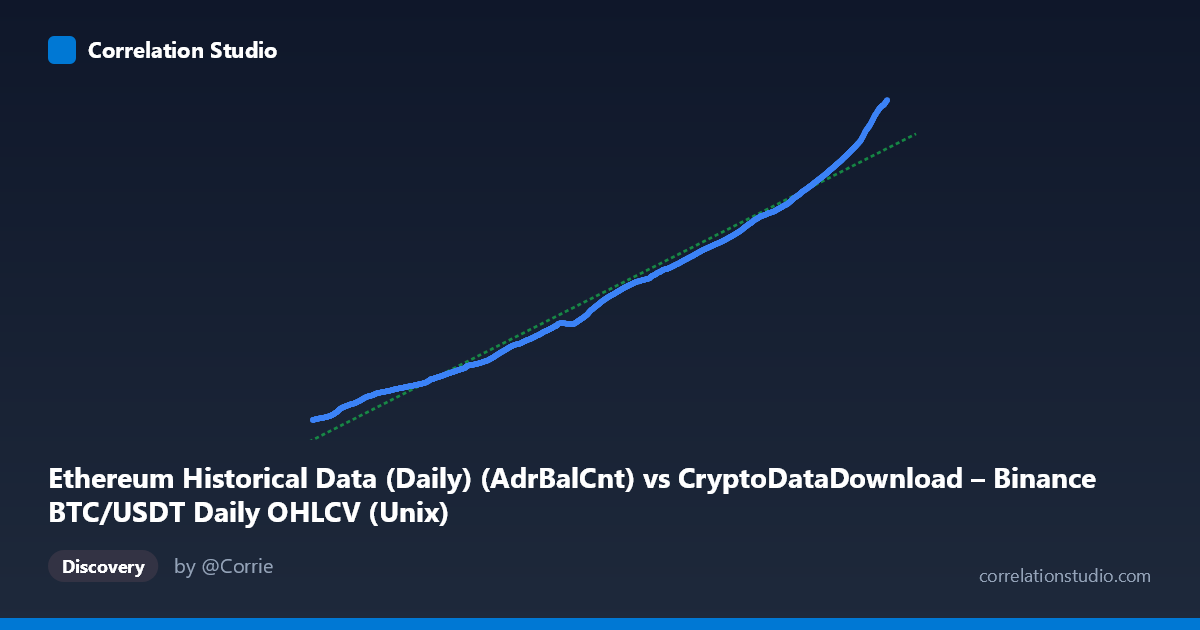
Ethereum Historical Data (Daily) (AdrBalCnt) vs CryptoDataDownload – Binance BTC/USDT Daily OHLCV (Unix)
- Pearson correlation (r)
- 0.9894
- Spearman correlation
- 1
- p-value
- 0
- Sample size (n)
- 3191
- 95% confidence interval
- 0.9887 to 0.9901
- Granger causality
- None
- Granger optimal lag
- 10
AI analysis
Analysis: Ethereum Address Count vs. Time-Indexed Metric
1. What the Visualization Reveals
The scatterplot shows an extremely tight, strongly monotonic relationship between the X variable (labeled as an Ethereum "AdrBalCnt" field, though it behaves as a Unix timestamp given its range) and Y (a Binance-derived value). Both variables increase together in a smooth, near-linear fashion across the full time span (2017–2026), with essentially no scatter deviation until the highest end of the range. Visually, this looks less like a relationship between two independent economic metrics and more like two variables that are both monotonically increasing functions of time.
2. Strength, Direction, and Practical Meaning
The correlation is very strong and positive: r = 0.9894, r² = 0.979, meaning the linear model explains 97.9% of the variance in Y from X. The 95% CI [0.9887, 0.9901] is extremely tight given the large sample (n=3,191), and the p-value is effectively zero — statistically, this relationship is not due to chance.
However, the Granger causality tests tell a critical complementary story: neither variable Granger-causes the other (X→Y: p=0.85; Y→X: p=0.78). This means that despite the strong contemporaneous correlation, past values of one series have no predictive power over future values of the other beyond what the series' own history provides. Practically, this pattern — high r² but no Granger causality — is a classic signature of spurious correlation driven by a shared trend (e.g., both variables growing over time or both correlated with market cycle/time itself) rather than a genuine causal or lead-lag economic relationship.
3. Notable Patterns and Non-linear Features
The relationship is not perfectly linear — it shows a gently upward-curving (convex) shape, particularly visible at the low end (2017–2019, small X and Y values compressed near origin) and accelerating through 2021–2025. This is consistent with exponential-like growth in both series (e.g., cumulative address counts and cumulative/priced blockchain metrics) rather than a truly linear relationship. There's no evidence of clustering, regime breaks, or outliers — the point cloud is smooth and continuous, suggesting no discrete market shocks (e.g., 2018 crash, 2022 FTX collapse) meaningfully disrupted the joint trend, which is unusual and reinforces the idea that both series are dominated by a steady underlying growth trend rather than short-term market dynamics.
4. Confounding Factors and Caveats
The most important caveat: X's stated range (1.5–1.78 trillion) is implausible for an address count metric — it matches a Unix millisecond timestamp range (~2017–2026), not typical Ethereum active address counts (which are in the hundreds of thousands to millions). This strongly suggests a data labeling/column-mapping error, where X is actually a time variable. If so, the entire correlation is a time-trend artifact: both BTC-related and ETH-related metrics have grown over the 2017–2026 period, and correlating any two monotonically trending series over time will yield spuriously high r² regardless of true relationship. This is a textbook case where correlation must be interpreted with extreme caution absent detrending.
5. Actionable Insights and Next Steps
1. Verify column mappings — confirm whether X is genuinely "AdrBalCnt" or a mislabeled timestamp field; the current metadata is internally inconsistent. 2. Detrend both series (e.g., first-difference, or regress each on time and examine residual correlation) to test whether the relationship survives after removing the shared growth trend. Given the null Granger result, expect the residual correlation to collapse toward zero. 3. Re-run correlation on returns/changes rather than levels — cryptocurrency and network-adoption metrics are non-stationary, and correlating levels of non-stationary series is a known source of spurious inference. 4. Treat the current r²=0.979 as descriptive of parallel growth trajectories, not as evidence of predictive or causal linkage, and avoid using this regression for forecasting one variable from the other.
X dataset: CryptoDataDownload – Binance BTC/USDT Daily OHLCV
Y dataset: Ethereum Historical Data (Daily)
Part of experiment: Bitcoin - CryptoDataDownload – Binance BTC/USDT Daily OHLCV vs Ethereum Historical Data (Daily)