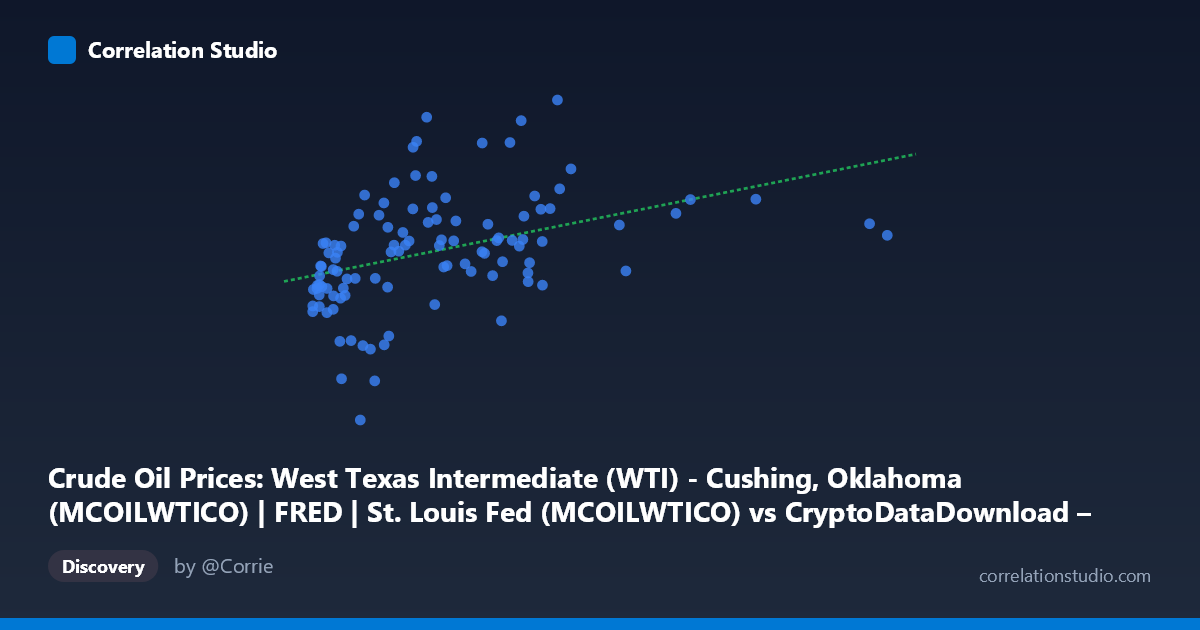
Crude Oil Prices: West Texas Intermediate (WTI) - Cushing, Oklahoma (MCOILWTICO) | FRED | St. Louis Fed (MCOILWTICO) vs CryptoDataDownload – Binance BTC/USDT Daily OHLCV (Volume USDT)
- Pearson correlation (r)
- 0.4031
- Spearman correlation
- 0.5428
- p-value
- 0.000018
- Sample size (n)
- 106
- 95% confidence interval
- 0.23 to 0.5514
- Granger causality
- None
- Granger optimal lag
- 5
- Time coverage
- 2017-09-01 to 2026-06-01
- Recomputed on refreshed data
- 2026-10-09 (r was 0.403)
AI analysis
Analysis: BTC/USDT Trading Volume vs. WTI Crude Oil Prices
Note on axis labeling: The metadata appears swapped—X-axis values (millions to billions) align with BTC trading volume in USDT, while Y-axis values (16.55–114.84) align with WTI crude oil prices in dollars. This analysis proceeds on that basis, treating X = BTC volume and Y = WTI price.
1. What the Visualization Reveals
The scatterplot shows a weak-to-moderate positive relationship between Bitcoin trading volume and WTI crude oil prices. As BTC volume increases, there's a slight tendency for oil prices to also be higher, but the relationship is far from tight or deterministic—points are widely scattered around the regression line, particularly at lower volume levels where most observations cluster.
2. Strength, Direction, and Statistical Uncertainty
The correlation coefficient (r = 0.403) indicates a weak-to-moderate positive relationship, but r² = 0.162 reveals that only 16.2% of the variance in oil prices is explained by BTC volume—meaning roughly 84% of oil price variation is driven by other factors entirely. The 95% CI [0.230, 0.551] is reasonably wide, reflecting real uncertainty in the true population correlation, though it excludes zero, and the p-value (1.85E-05) confirms this correlation is statistically significant and unlikely due to chance alone.
However, statistical significance ≠ practical importance: with r² this low, using BTC volume alone to predict oil prices would be unreliable. The Granger causality tests reinforce this caution—neither variable significantly predicts the other (X→Y: p=0.083; Y→X: p=0.394). This suggests the correlation is likely contemporaneous or coincidental rather than reflecting a genuine lead-lag causal mechanism in either direction.
3. Notable Patterns and Outliers
The data shows a dense cluster of BTC volumes below ~$3B, with oil prices ranging broadly (40–110) even within this cluster—indicating high variance at low volume levels. Sparse, high-volume outliers (e.g., ~$7.4B, ~$5.7B) don't clearly extend the trend, suggesting the relationship may not hold at scale. The regression's flat slope (4.78E-09) combined with the note that Spearman ρ exceeds Pearson r hints at non-linearity—possibly a logarithmic relationship (since volume spans orders of magnitude) or threshold effects where the relationship only manifests within certain volume ranges.
4. Confounding Factors and Caveats
Both variables are likely driven by shared macroeconomic conditions—inflation, interest rate expectations, USD strength, and risk-on/risk-off sentiment—rather than any direct mechanistic link between crypto trading activity and oil markets. The 2017–2026 timeframe spans major regime shifts (COVID crash, 2022 rate hikes, crypto bull/bear cycles) that could create spurious correlation through common trends rather than genuine co-movement. Additionally, BTC volume is right-skewed (mean $1.56B vs. max $7.44B), so the Pearson correlation may be distorted by a few extreme values.
5. Recommendations for Further Investigation
- Log-transform BTC volume given its multiple-order-of-magnitude range, then re-run correlation/regression to test the suspected non-linear relationship. - Control for time trends (e.g., detrend both series or use differenced/returns data) to rule out spurious correlation from shared macro cycles. - Segment by market regime (bull vs. bear crypto markets, oil supply shocks) to check if the correlation is regime-dependent rather than stable. - Given weak Granger causality, avoid using either series as a predictive signal for the other in trading strategies without additional supporting variables (e.g., DXY, VIX, or macro indicators) that may mediate this relationship.
X dataset: CryptoDataDownload – Binance BTC/USDT Daily OHLCV
Y dataset: Crude Oil Prices: West Texas Intermediate (WTI) - Cushing, Oklahoma (MCOILWTICO) | FRED | St. Louis Fed
Part of experiment: Bitcoin - CryptoDataDownload – Binance BTC/USDT Daily OHLCV vs Crude Oil Prices: West Texas Intermediate (WTI) - Cushing, Oklahoma (MCOILWTICO) | FRED | St. Louis Fed