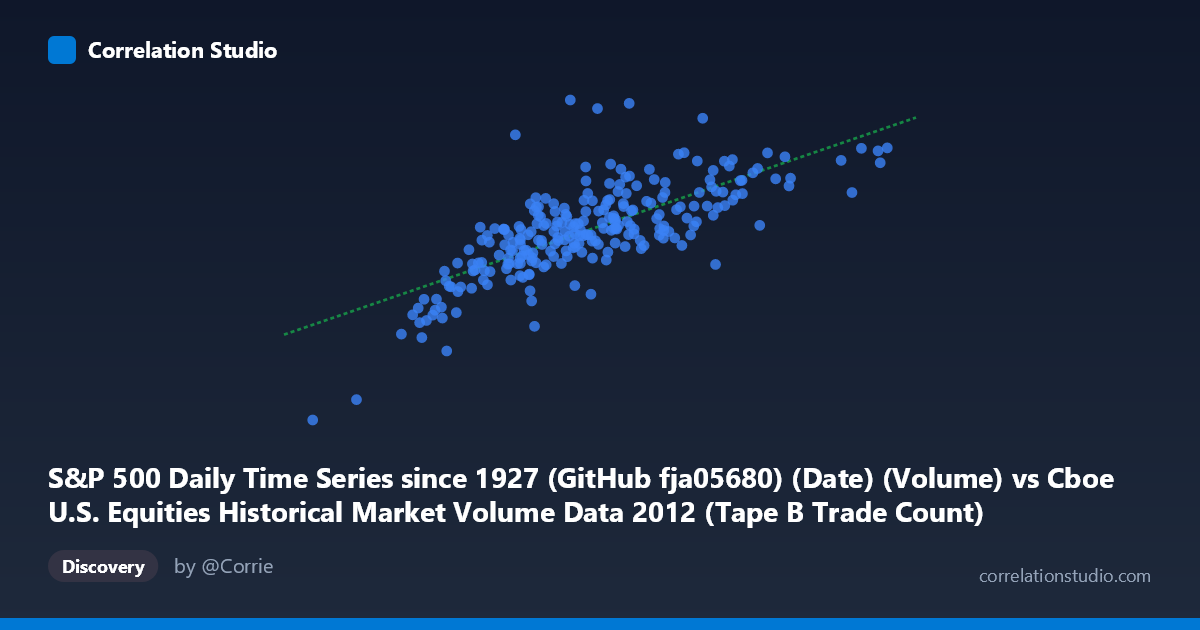
S&P 500 Daily Time Series since 1927 (GitHub fja05680) (Date) (Volume) vs Cboe U.S. Equities Historical Market Volume Data 2012 (Tape B Trade Count)
- Pearson correlation (r)
- 0.7379
- Spearman correlation
- 0.7446
- p-value
- 0
- Sample size (n)
- 250
- 95% confidence interval
- 0.6757 to 0.7897
- Granger causality
- None
- Granger optimal lag
- 10
AI analysis
Analysis: S&P 500 Daily Volume vs. Cboe Tape B Trade Count (2012)
Relationship Overview The scatterplot reveals a moderately strong positive relationship between S&P 500 daily trading volume and Cboe Tape B trade count across 2012. As daily volume increases, trade counts rise in a broadly linear fashion, consistent with the regression equation y = 10,576.9x + 1.775×10⁹. This makes intuitive sense: higher overall market participation tends to manifest simultaneously across both aggregate volume metrics and exchange-level trade counts, reflecting shared underlying market activity drivers such as macroeconomic events, volatility episodes, and institutional rebalancing.
Correlation Strength and Statistical Significance The Pearson correlation of r = 0.7379 indicates a moderately strong positive association, with r² = 0.5445 meaning that approximately 54.4% of the variance in Tape B trade count is explained by S&P 500 volume. While meaningful, this leaves nearly half the variance unexplained, suggesting other factors are at play. The 95% confidence interval [0.6757, 0.7897] is relatively tight and does not approach zero, and the p-value of effectively 0 confirms the relationship is highly statistically significant across the 250-observation sample. However, the Granger causality results tell a more cautious story: neither direction (X→Y: F=1.063, p=0.392; Y→X: F=1.026, p=0.422) achieves significance even at the optimal 10-period lag, meaning neither variable reliably predicts the other temporally. This implies the correlation reflects contemporaneous co-movement driven by common external forces rather than a directional predictive relationship.
Notable Patterns, Clusters, and Outliers The data exhibit a moderately tight central cluster roughly between X values of 130,000–230,000 and Y values of 3.0–4.5 billion trades, consistent with typical 2012 trading conditions. Several notable outliers stand out: the point near (168,578, 5,271,490,000) shows an exceptionally high trade count despite only moderate volume — a clear high-leverage outlier potentially tied to a specific market event, options expiration, or data anomaly. Similarly, the cluster of low-volume, low-count observations below X=115,000 (including points near 104,220 and 109,845) may reflect holiday-adjacent or summer sessions with suppressed activity. At the high-volume end, points near X=295,122 and X=245,060 extend the range considerably but remain broadly consistent with the regression trend.
Confounding Factors and Caveats Several important caveats apply. First, both variables are likely driven by common latent factors — VIX-driven volatility spikes, Federal Reserve announcements, earnings seasons, or index rebalancing events — which would inflate the apparent correlation without implying any direct causal link. Second, the S&P 500 volume metric aggregates broadly while Tape B specifically covers NYSE Arca and regional exchanges, so the relationship captures partial rather than full market overlap. Third, market structure changes during 2012, including HFT activity and fragmentation across dark pools, could create non-stationarity in the trade count–volume relationship that a single linear model does not capture. The single-year time window (2012) also limits generalizability, as that year had distinctly moderate volatility conditions.
Actionable Insights and Further Investigation Practitioners should investigate the high trade count outlier (~5.27 billion) to determine whether it represents a genuine market event or a data quality issue, as it may disproportionately influence regression parameters. Future analysis should incorporate VIX or realized volatility as a control variable to disentangle the shared variance driven by market stress from any direct volume–trade count relationship. Given the absence of Granger causality, these variables should not be used as predictors of each other in forecasting models without additional conditioning variables. Extending the analysis across multiple years would test whether r² stability holds across different volatility regimes. Finally, decomposing Tape B trade count by trade size could reveal whether the unexplained 45.6% variance is driven by algorithmic micro-trading patterns that are orthogonal to index-level volume dynamics.
X dataset: Cboe U.S. Equities Historical Market Volume Data 2012
Y dataset: S&P 500 Daily Time Series since 1927 (GitHub fja05680) (Date)
Part of experiment: Daily - Cboe U.S. Equities Historical Market Volume Data 2012 vs S&P 500 Daily Time Series since 1927 (GitHub fja05680) (Date)