Bitcoin Historical Data (2010-2024) (IssTotNtv) vs CryptoDataDownload – Binance BTC/USDT Daily OHLCV (Unix)
- Pearson correlation (r)
- -0.8815
- Spearman correlation
- -0.8379
- p-value
- 0
- Sample size (n)
- 938
- 95% confidence interval
- -0.895 to -0.8663
- Granger causality
- None
- Granger optimal lag
- 9
- Time coverage
- 2017-08-20 to 2026-05-20
AI analysis
Analysis of Bitcoin Historical Data Correlation
1. Overview of the Relationship
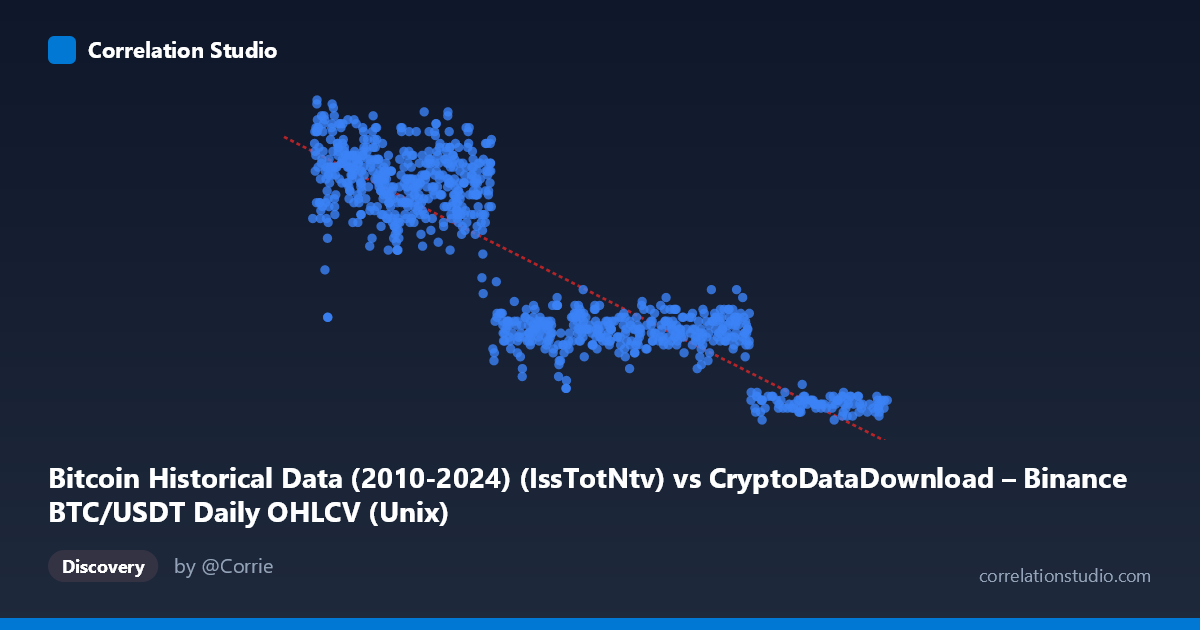
The scatterplot depicts a strong negative linear relationship between a time-indexed X variable (essentially a timestamp/date proxy) and Y (a Bitcoin-related metric ranging from 350–2375). As X increases from mid-2017 through 2026, Y declines steadily and consistently — early data points (2017–2019) cluster in the 1700–2225 range, while later points (2023–2026) fall to 425–950. This produces a clear downward-sloping band across the full time span, with no evidence of a returning or cyclical pattern within this window.
2. Strength, Direction, and Uncertainty
The correlation coefficient (r = -0.8815) indicates a strong negative association, and r² = 0.777 means roughly 78% of the variance in Y is statistically explained by X (or more precisely, by time) — a substantial figure for real-world data, though it also leaves ~22% unexplained by this simple linear model. The 95% confidence interval [-0.8950, -0.8663] is tight, and the p-value of ~0 confirms this relationship is highly unlikely to be due to chance, given the large sample (n=938).
However, the Granger causality tests reveal an important nuance: neither variable meaningfully "predicts" the other in a temporal/sequential sense (X→Y: p=0.42; Y→X: p=0.15). This suggests the strong correlation is likely driven by both variables independently trending over time (i.e., a shared temporal trend or drift) rather than one causally driving fluctuations in the other. This is a classic case where correlation reflects co-movement with time rather than a dynamic predictive relationship.
3. Patterns and Notable Features
The scatter shows a fairly consistent linear decay, but with visible dispersion/banding — at any given X value, Y can vary by several hundred units (e.g., around X≈1574000000000, Y ranges from 1650–2100). This scatter band suggests underlying volatility, seasonality, or regime shifts (bull/bear cycles) superimposed on the overall trend. No sharp outliers are apparent, but the data may contain subtle non-linear inflection points (e.g., a possible plateau or slight curvature in the 2020–2021 region) that a linear fit would smooth over. The right tail (2024–2026) shows tighter clustering at lower values, hinting at reduced variance or a flooring effect.
4. Confounding Factors and Caveats
Since X is fundamentally a timestamp, this "correlation" is really a trend-vs-time regression, which is prone to spurious correlation — many unrelated series trend over multi-year periods. Bitcoin's known boom-bust cycles (2017 peak, 2018 crash, 2020-21 rally, 2022 crash) mean the "true" relationship is likely non-monotonic/cyclical rather than linear; a straight-line fit over 8+ years will artificially inflate r² for any variable that trends downward overall while masking cyclical reversals. Additionally, Y's exact definition (labeled ambiguously as "Unix" in the metadata) raises data-quality concerns — verify units and ensure Y isn't itself a transformed timestamp or index rather than a genuine price/activity metric.
5. Suggestions for Further Investigation
- Test for non-stationarity: Both series likely have unit roots (trending); run Augmented Dickey-Fuller tests and consider differencing before further causal analysis, since Granger causality on non-stationary data can be unreliable. - Segment by market regime: Break the data into bull/bear cycles (2017-18, 2020-21, 2022-23) and re-run correlation/regression to check if the relationship holds locally or is an artifact of long-term drift. - Detrend and re-correlate: Remove the linear time trend from both series and examine residual correlation to isolate any genuine relationship beyond shared drift. - Clarify variable definitions: Confirm what Y actually measures (price? active addresses? market cap?) since the dataset description mentions multiple candidate metrics.
X dataset: CryptoDataDownload – Binance BTC/USDT Daily OHLCV
Y dataset: Bitcoin Historical Data (2010-2024)
Part of experiment: Bitcoin - CryptoDataDownload – Binance BTC/USDT Daily OHLCV vs Bitcoin Historical Data (2010-2024)