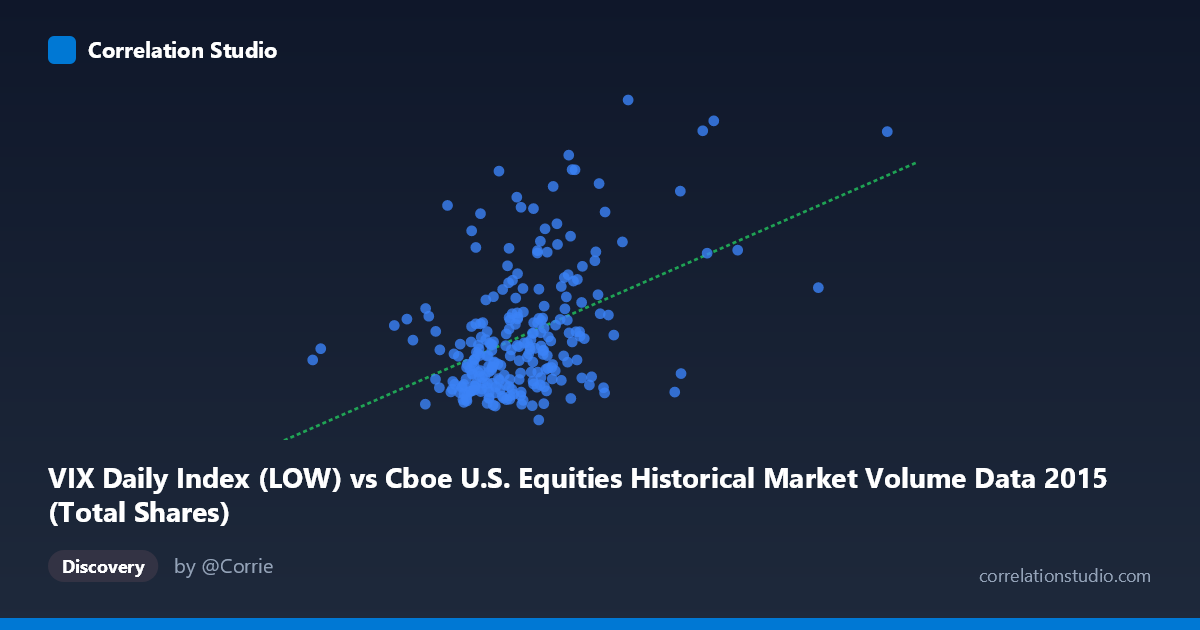
VIX Daily Index (LOW) vs Cboe U.S. Equities Historical Market Volume Data 2015 (Total Shares)
- Pearson correlation (r)
- 0.4532
- Spearman correlation
- 0.3817
- p-value
- 0
- Sample size (n)
- 252
- 95% confidence interval
- 0.3492 to 0.5462
- Granger causality
- None
- Granger optimal lag
- 1
AI analysis
Scatterplot Analysis: VIX Total Shares vs. VIX Daily Index (Low)
Overall Relationship The scatterplot reveals a moderate positive relationship between the Cboe U.S. Equities Historical Market Volume (VIX Daily Index Low, X-axis) and VIX Total Shares (Y-axis) across 252 trading days in 2015. As market volume increases, VIX levels tend to rise, which aligns with the intuitive understanding that heightened market activity and higher volatility often co-occur. The linear regression equation (y = 1.697E-08x + 6.896) confirms this upward trend, though the scatter around the regression line is visibly substantial, suggesting the relationship is real but far from deterministic.
Correlation Strength and Statistical Significance The correlation coefficient of r = 0.4532 indicates a moderate positive association, but the more practically informative metric is r² = 0.2054 — meaning only ~20.5% of the variance in VIX Total Shares is explained by market volume levels. The remaining ~79.5% is attributable to other factors entirely. The 95% confidence interval for r [0.349, 0.546] is reasonably tight given n = 252, and the p-value of 3.597E-14 confirms the correlation is highly statistically significant, effectively ruling out chance. However, statistical significance here is partly a function of the large population size (N = 3,302), so significance should not be conflated with practical importance. Critically, Granger causality analysis finds no significant temporal predictive direction in either direction (X→Y: F = 0.069, p = 0.794; Y→X: F = 0.013, p = 0.909), meaning that past values of market volume do not reliably predict future VIX levels and vice versa at the 1-period lag tested. The correlation reflects co-movement, not a leading-lagging predictive relationship.
Notable Patterns, Clusters, and Outliers The data cloud shows a few distinct features worth noting. The bulk of observations cluster in the X range of roughly 430M–650M with VIX values between 11 and 20, forming a moderately dense core. However, several high-leverage outliers are visible in the upper-right region — notably points near (808M, 28.1), (815M, 20.8), and (649M, 24.9) — which likely correspond to late-August 2015 market turbulence (the "flash crash" period), when both volume and volatility spiked dramatically. One notable anomaly appears at the far left (~207M, 14.5), representing an unusually low-volume day with a moderate VIX reading. These extreme observations likely exert disproportionate influence on the regression slope and correlation coefficient, and the relationship may be weaker in the central cluster than the overall r suggests.
Confounding Factors and Caveats Several important caveats apply to interpreting this correlation. First, both variables are jointly driven by market stress events — episodes like the August 2015 selloff simultaneously inflate volume and VIX, creating a spurious-looking relationship that reflects a common underlying cause (investor panic) rather than a direct causal link. Second, the X and Y axis labels appear potentially swapped in the dataset metadata (VIX Low values in the hundreds of millions are anomalous for a volatility index, which typically ranges 10–80), suggesting possible data labeling or join inconsistencies that warrant verification. Third, seasonality and day-of-week effects in equity market volume could confound the relationship. Finally, the Granger causality result — testing only lag 1 — may miss longer-horizon dynamics, and should be extended to multiple lags before concluding no predictive relationship exists.
Actionable Insights and Further Investigation Given these findings, several next steps are recommended. Segment the analysis by removing or separately modeling the August 2015 volatility event to assess whether the correlation holds in "normal" vs. "stress" regimes — this would clarify whether the relationship is structural or episodic. Test multiple Granger causality lags (2–10 periods) to more robustly assess temporal directionality. Incorporate additional explanatory variables such as S&P 500 returns, bid-ask spreads, or options volume to build a more complete model of VIX variance, given that 79.5% remains unexplained. Finally, verify the dataset alignment and column labels before drawing any operational conclusions, as the volume scale in the hundreds of millions for a "VIX Low" column strongly suggests a potential data preparation error that could invalidate the current findings entirely.
X dataset: Cboe U.S. Equities Historical Market Volume Data 2015
Y dataset: VIX Daily Index
Part of experiment: Daily - Cboe U.S. Equities Historical Market Volume Data 2015 vs VIX Daily Index