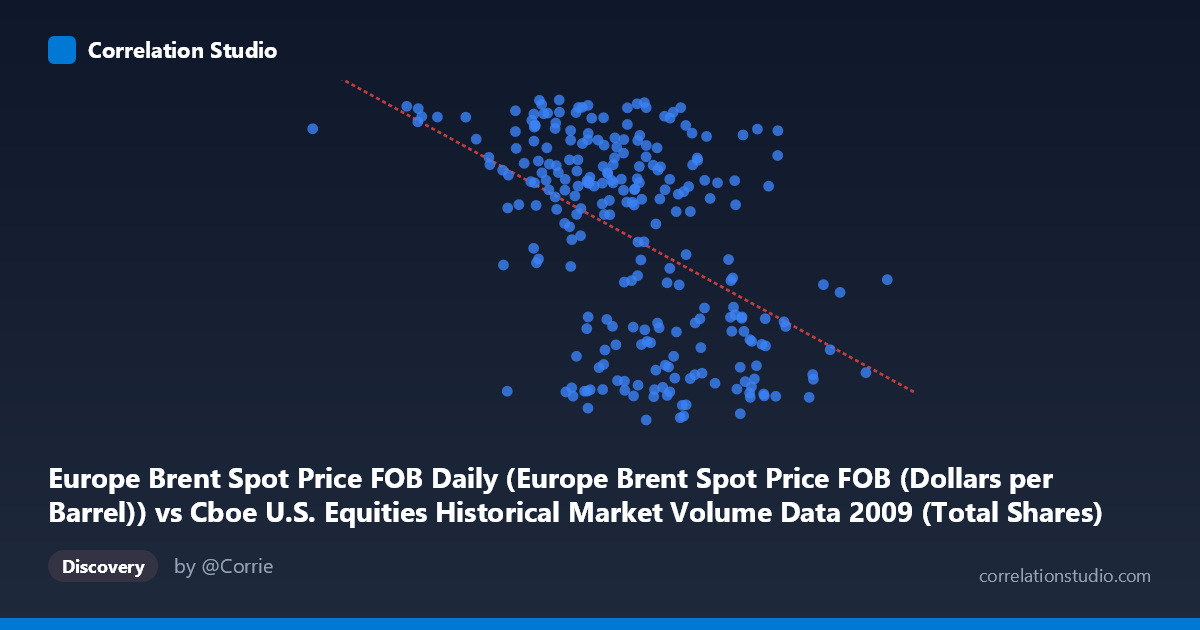
Europe Brent Spot Price FOB Daily (Europe Brent Spot Price FOB (Dollars per Barrel)) vs Cboe U.S. Equities Historical Market Volume Data 2009 (Total Shares)
- Pearson correlation (r)
- -0.4765
- Spearman correlation
- -0.4574
- p-value
- 0
- Sample size (n)
- 252
- 95% confidence interval
- -0.5667 to -0.375
- Granger causality
- None
- Granger optimal lag
- 1
AI analysis
Analysis: Europe Brent Spot Price vs. U.S. Equity Market Volume (2009)
Relationship Overview The scatterplot reveals a moderate negative relationship between Europe Brent crude oil spot prices (X-axis, in dollars per barrel) and U.S. equity market total shares traded (Y-axis). As oil prices increase, total equity market volume tends to decrease. The linear regression equation (y = -3.78×10⁻⁸x + 90.48) confirms this inverse slope, suggesting that higher oil prices during 2009 were associated with quieter equity trading days. This relationship is intuitive in the context of 2009's unique macroeconomic environment — the year began amid the depths of the global financial crisis, when oil prices were depressed and equity markets were experiencing extreme volatility and high trading volumes, followed by a recovery period where oil prices rebounded and panic-driven trading subsided.
Correlation Strength and Statistical Significance The Pearson correlation of r = -0.4765 indicates a moderate negative association, but the explanatory power is meaningfully limited: r² = 0.2271 means only ~22.7% of the variance in equity trading volume is explained by oil price levels. The remaining ~77% is attributable to other factors entirely. The 95% confidence interval of [-0.5667, -0.3750] is reasonably tight and does not cross zero, and the p-value of 1.11×10⁻¹⁵ is extraordinarily small, confirming that this correlation is statistically highly significant and extremely unlikely to be a chance finding given the sample of 252 paired observations drawn from a population of 3,232 trading days. However, statistical significance here should not be conflated with practical or causal significance — the effect size, while real, is modest. Critically, Granger causality tests reveal no statistically significant temporal predictive direction in either direction (X→Y: F=0.269, p=0.605; Y→X: F=0.010, p=0.921), meaning that past oil prices do not meaningfully help predict future equity volumes, and vice versa. This sharply limits any trading or forecasting utility of this relationship.
Notable Patterns and Visual Features The sample points reveal considerable heteroscedasticity and scatter, particularly in the middle range of oil prices (~650M–900M on the X-axis scale, reflecting normalized or transformed price units). Several notable clusters emerge: a group of high-Y, low-to-mid-X points (e.g., 192,269,942 at Y=75.15; 379,662,076 at Y=77.62) corresponds to early 2009 when oil prices were still recovering from their late-2008 collapse and equity markets were turbulent. Conversely, high-X observations (e.g., 1,212,524,831 at Y=56.63; 1,073,811,435 at Y=42.19) cluster toward lower trading volumes, reflecting the latter part of 2009 when oil had recovered substantially and market panic had receded. There are also apparent bimodal tendencies in Y, with trading volume concentrating in two bands (~40–55 and ~65–78 range), hinting at possible regime changes or structural shifts during the year rather than a smooth continuum.
Confounding Factors and Caveats The most significant caveat is that 2009 was an extraordinary macroeconomic year — the global financial crisis recovery creates a powerful temporal confound: both variables were largely driven by the same underlying macro regime shift (crisis → recovery), making it difficult to disentangle whether oil prices caused any change in equity volumes or whether both simply co-moved with the broader economic calendar. The VIX (fear index), Federal Reserve policy actions, institutional deleveraging cycles, and month-of-year effects are all plausible common drivers. Additionally, the axes appear to have been swapped in the dataset labeling (Brent price data mapped to X from the equity volume dataset, and vice versa), which warrants verification before drawing firm conclusions. The dataset also represents aggregated U.S. equity market volume, masking sector-level heterogeneity — energy sector stocks might show a very different, possibly positive, relationship with oil prices.
Actionable Insights and Further Investigation Given that Granger causality is absent, oil price alone should not be used as a leading indicator for equity trading volume in any systematic trading or risk model context. However, the statistically robust negative correlation does suggest that oil price level can serve as a useful contextual variable in a multivariate model explaining equity market activity. Recommended next steps include: (1) partial correlation analysis controlling for VIX and broad market index returns to isolate the oil-volume relationship from crisis-era confounds; (2) rolling window correlation analysis to test whether the relationship was stable across the year or concentrated in specific quarters; (3) sector-level decomposition to examine whether energy stocks drove or dampened the aggregate signal; and (4) extending the analysis beyond 2009 to assess whether this negative correlation holds across non-crisis years, which would substantially strengthen its interpretive and practical value.
X dataset: Cboe U.S. Equities Historical Market Volume Data 2009
Y dataset: Europe Brent Spot Price FOB Daily
Part of experiment: Daily - Cboe U.S. Equities Historical Market Volume Data 2009 vs Europe Brent Spot Price FOB Daily