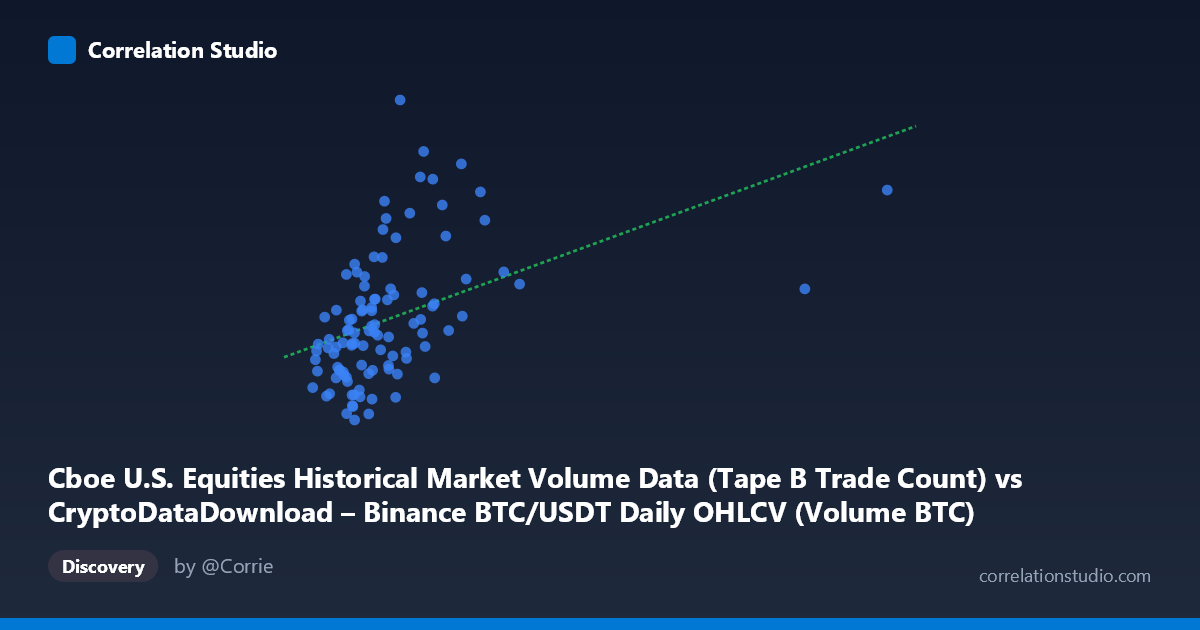
Cboe U.S. Equities Historical Market Volume Data (Tape B Trade Count) vs CryptoDataDownload – Binance BTC/USDT Daily OHLCV (Volume BTC)
- Pearson correlation (r)
- 0.4351
- Spearman correlation
- 0.5436
- p-value
- 0.000004
- Sample size (n)
- 104
- 95% confidence interval
- 0.2647 to 0.5792
- Granger causality
- None
- Granger optimal lag
- 10
- Time coverage
- 2026-01-02 to 2026-06-25
- Recomputed on refreshed data
- 2026-10-24 (r was 0.4351)
AI analysis
Analysis: Cboe Trade Count vs. Binance BTC/USDT Volume
1. Overall Relationship
The scatterplot shows a weak-to-moderate positive relationship between the two variables. Most observations cluster tightly in the lower-left region (X: 10,000–30,000; Y: 650,000–1,400,000), with a sparse scattering of higher-X outliers (notably ~92,500 and ~106,300) that pull the regression line's slope upward. Within the dense cluster, the relationship looks noisy and nearly cloud-like, with substantial vertical spread (Y ranging from ~700K to ~1.8M) even for very similar X values (e.g., X≈16,000–24,000 spans nearly the entire Y range). This suggests the two extreme-X points are exerting disproportionate influence on the fitted line.
2. Strength, Direction, and Statistical Confidence
The Pearson correlation (r = 0.447) indicates a modest positive linear association, with r² = 0.20 meaning only 20% of the variance in Y is explained by X — leaving 80% attributable to other factors or noise. The 95% CI [0.265, 0.599] is fairly wide, reflecting real uncertainty in the point estimate, though it excludes zero and the p-value (9.9×10⁻⁶) confirms the correlation is statistically significant and not due to chance in this sample. However, statistical significance here reflects a real but weak linear association rather than a strong predictive relationship — with r² this low, X alone is a poor predictor of Y in practice.
Critically, the Granger causality tests (F = 0.66, p = 0.75 for X→Y; F = 0.51, p = 0.88 for Y→X) show no significant temporal predictive direction in either direction. This means that past values of Cboe trade counts do not help forecast future Binance volume, and vice versa — the correlation is likely contemporaneous/coincidental (e.g., both may respond to shared macro conditions like overall market volatility or risk sentiment) rather than one variable driving the other over time.
3. Notable Patterns and Outliers
- Dense low-X cluster: The bulk of data (X < 30,000) shows essentially no visible trend — Y values are highly dispersed regardless of X. - High-leverage outliers: Two points (X ≈ 92,539 and 106,299) sit far outside the main cluster and likely account for much of the positive slope in the linear fit. Removing them would likely reduce r further, suggesting the "significant" correlation may be partly an artifact of these leverage points. - Vertical banding: Multiple Y values exceeding 1.3M cluster around X = 20,000–35,000, hinting at episodic volume spikes (possibly corresponding to specific dates/market events) unrelated to the X variable. - The regression line (y = 8.12x + 825,125) has a large intercept relative to the slope's contribution, reinforcing that X explains a small fraction of Y's baseline level and variability.
4. Confounding Factors and Caveats
- Mismatched instruments: Comparing Cboe equities trade counts to Binance BTC/USDT volume conflates two structurally different markets (traditional equities vs. crypto), which may share only indirect linkages (e.g., macro risk-on/risk-off sentiment, shared volatility regimes, or overlapping trading hours/days). - Leverage/outlier sensitivity: With n = 90, two or three extreme X points can meaningfully distort r and the regression slope — the relationship may not hold under robust/rank-based methods. - Non-linearity: The note that Spearman ρ exceeds Pearson r suggests the true relationship (if any) may be non-linear (e.g., logarithmic in X), meaning linear r² likely understates or mischaracterizes any monotonic association. - Temporal aggregation mismatch: Volume/count units and time granularity may not be perfectly aligned (daily equities trade count vs. daily crypto volume), and no lead-lag structure was found, undermining causal interpretation.
5. Actionable Insights
- Re-run correlation with outliers removed or winsorized to test robustness of r and the regression slope — the true "typical" relationship may be closer to zero. - Test log-transformed X (or both variables) given the right-skewed X distribution and the Spearman/Pearson divergence — this may reveal a cleaner non-linear fit. - Investigate the two high-X outliers directly — are they specific dates with unusual equity market activity (e.g., index rebalancing, options expiration) that coincidentally overlap with crypto volume spikes? - Avoid causal claims: Given the null Granger results, do not use Cboe trade counts as a leading indicator for BTC volume (or vice versa) in trading/forecasting models. - Explore shared third factors (e.g., VIX, overall crypto market cap, macro news days) that might simultaneously drive both variables, which could explain the modest contemporaneous correlation better than a direct link.
X dataset: CryptoDataDownload – Binance BTC/USDT Daily OHLCV
Y dataset: Cboe U.S. Equities Historical Market Volume Data
Part of experiment: Bitcoin - CryptoDataDownload – Binance BTC/USDT Daily OHLCV vs Cboe U.S. Equities Historical Market Volume Data