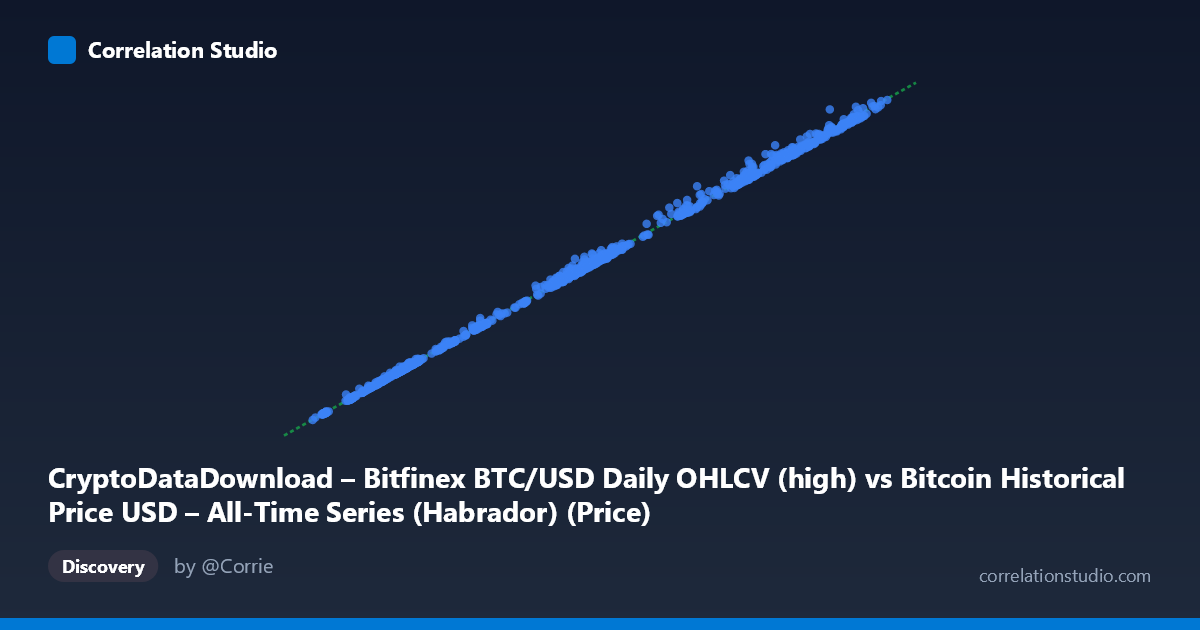
CryptoDataDownload – Bitfinex BTC/USD Daily OHLCV (high) vs Bitcoin Historical Price USD – All-Time Series (Habrador) (Price)
- Pearson correlation (r)
- 0.9995
- Spearman correlation
- 0.9992
- p-value
- 0
- Sample size (n)
- 1134
- 95% confidence interval
- 0.9995 to 0.9996
- Granger causality
- None
- Granger optimal lag
- 10
- Time coverage
- 2020-07-19 to 2025-10-15
- Recomputed on refreshed data
- 2026-10-24 (r was 0.9995)
AI analysis
Analysis: Bitcoin Price Cross-Exchange Correlation (Habrador vs. Bitfinex)
1. What the Visualization Reveals
The scatterplot shows an extremely tight, near-perfect linear relationship between two BTC/USD price series spanning July 2020 through October 2025. Points hug a line with slope ≈1.01 and intercept ≈160, indicating that for virtually the entire price range (~$9,300 to ~$126,000), the two series track each other almost exactly, with Y running marginally higher than X (consistent with the "high" price typically exceeding other reference prices like open/close on a given day).
2. Strength, Direction, and Statistical Meaning
With r = 0.9995 and r² = 0.9991, essentially 99.9% of the variance in one series is explained by the other — this is about as strong a linear relationship as occurs in real-world financial data. The 95% CI [0.9995, 0.9996] is razor-narrow, and p ≈ 0 confirms this is not a chance artifact even before considering that N/n are large. However, the Granger causality test is the critical caveat: neither direction shows significant predictive power (X→Y: p=0.218; Y→X: p=0.186). This means despite the strong contemporaneous correlation, neither series reliably predicts the other's future movements at daily lags — the relationship is simultaneous, not causal/sequential. Practically: these are two measurements of the same underlying asset price, not two independent variables where one drives the other over time.
3. Notable Patterns and Features
- No meaningful outliers or regime breaks: points across the entire $9K–$126K range fall on the same line, indicating consistency through multiple bull/bear cycles (2020-21 bull run, 2022 bear market, 2023-25 recovery). - Slight fan-out at higher values: a few sample pairs (e.g., 66819.91/70162, 60981/64217, 96678/99222) show larger absolute gaps at higher price levels, suggesting the residual spread scales with price magnitude — consistent with proportional (percentage-based) rather than fixed-dollar discrepancies between exchanges/fields. - Slope slightly 1: Y (Bitfinex) tends to run marginally above X, plausibly reflecting exchange-specific premiums, "high" vs "close" price differences, or Bitfinex's historical BTC premium during certain periods.
4. Confounding Factors and Caveats
The central caveat is that this is not a correlation between two distinct economic variables — it is two overlapping measurements of the same asset (Bitcoin price) from different sources/fields. One dataset ("Habrador," presumably aggregated/all-time series) and one is Bitfinex-specific OHLCV high price. High correlation is expected and somewhat trivial; the real signal lies in the small residuals (~1.3% average slope deviation), which may reflect: - Exchange-specific liquidity/arbitrage gaps (Bitfinex vs. aggregate index) - Timestamp/timezone misalignment between daily bars - Whether "high" is being compared against a different price type (close, average, etc.) in the other series - Sample size mismatch (n=1,134 paired vs. N=3,902 population) — only ~29% of available data points were paired, raising questions about how the alignment/matching was done and whether missing data is randomly distributed across time.
5. Actionable Insights
- Don't overinterpret r² as evidence of one series "explaining" the other in a modeling sense — given the Granger result, this pair is unsuitable for lead-lag trading signals or forecasting one from the other's past values. - Investigate the residuals directly: plot (Y−X) or the percentage deviation over time to identify whether the Bitfinex premium/discount is time-varying (e.g., larger during high-volatility periods or specific market stress events like 2022 exchange collapses). - Clarify the pairing methodology for the 1,134 of 3,902 records — check whether unmatched dates cluster in specific periods (e.g., early Bitfinex history or Habrador data gaps), which could bias the correlation upward by excluding harder-to-reconcile periods. - Use this pair for data validation/reconciliation, not causal analysis — it's better suited to confirming data quality across sources than to studying genuine market dynamics between two independent instruments.
X dataset: Bitcoin Historical Price USD – All-Time Series (Habrador)
Y dataset: CryptoDataDownload – Bitfinex BTC/USD Daily OHLCV
Part of experiment: Bitcoin - Bitcoin Historical Price USD – All-Time Series (Habrador) vs CryptoDataDownload – Bitfinex BTC/USD Daily OHLCV