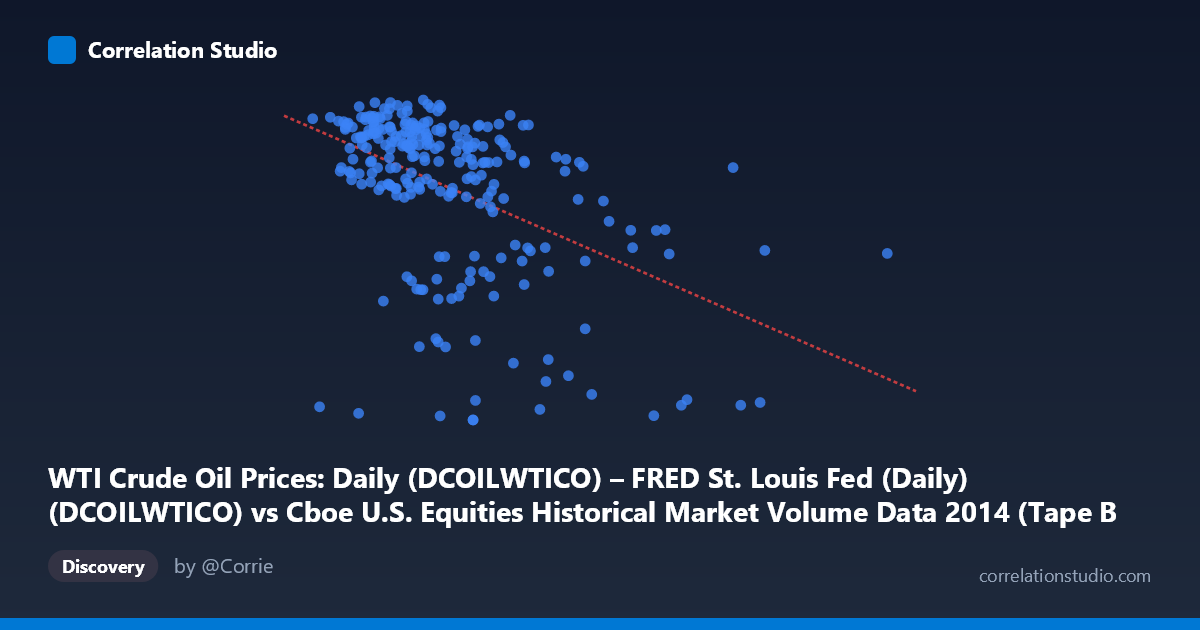
WTI Crude Oil Prices: Daily (DCOILWTICO) – FRED St. Louis Fed (Daily) (DCOILWTICO) vs Cboe U.S. Equities Historical Market Volume Data 2014 (Tape B Shares)
- Pearson correlation (r)
- -0.4731
- Spearman correlation
- -0.4779
- p-value
- 0
- Sample size (n)
- 252
- 95% confidence interval
- -0.5637 to -0.3712
- Granger causality
- None
- Granger optimal lag
- 2
AI analysis
Scatterplot Analysis: WTI Crude Oil Prices vs. Cboe Tape B Share Volume (2014)
Relationship Overview
The scatterplot reveals a moderate negative relationship between WTI crude oil prices (X-axis, in USD/barrel scaled to daily price values) and Cboe Tape B share volumes (Y-axis, in shares traded). As crude oil prices increase, Tape B equity share volumes tend to decline, and conversely, lower oil prices are associated with higher trading volumes. The linear regression equation (y = -2.70344E⁻⁷x + 113.514) confirms this inverse slope, though the scatter around the regression line is considerable, indicating substantial unexplained variation. The relationship is most visually apparent at the extremes: the highest-volume trading days cluster at lower oil price levels, while days with elevated oil prices tend to show more subdued equity volume activity.
Correlation Strength and Statistical Significance
The Pearson correlation of r = -0.4731 indicates a moderate negative association — meaningful but far from deterministic. Critically, the R² of 0.2238 means that WTI crude oil prices explain only about 22.4% of the variance in Tape B share volumes, leaving roughly 77.6% attributable to other factors. The 95% confidence interval for r of [-0.5637, -0.3712] is reasonably tight and sits entirely in negative territory, providing strong confidence that the inverse relationship is real rather than a sampling artifact. The p-value of 1.776E-15 is extraordinarily small, confirming high statistical significance given the sample of 252 paired observations drawn from a population of 3,686. However, statistical significance should not be conflated with practical importance — the effect size remains moderate at best. Notably, the Granger causality tests show no significant predictive direction in either direction (X→Y: F=1.80, p=0.168; Y→X: F=0.295, p=0.745), meaning that past oil prices do not significantly help forecast future Tape B volumes, and vice versa. This absence of temporal predictive power is an important caution: the correlation appears to reflect co-movement driven by shared external forces rather than any direct causal pathway between these two variables.
Notable Patterns, Clusters, and Outliers
Several structural features stand out in the data. There is a dense cluster of points in the upper-left region — oil prices roughly in the $60–90 range paired with Tape B volumes between ~95–108 — suggesting that for most of the year, trading was active while oil prices were moderate to slightly elevated. A second, more dispersed lower cluster appears at very low Y values (~54–66), spread across a wide range of X values, pointing to specific days of anomalously low Tape B volume regardless of oil price level; these are likely outliers or structurally different trading sessions (e.g., holidays, half-days, or market disruptions). On the right side of the chart, several points at high oil price values ($140M scale equivalent) show sharply reduced volumes, consistent with the negative trend. The point at approximately (155M, 55.97) and (162M, 82.33) are particularly notable high-X observations that pull the regression line and may exert disproportionate leverage on the correlation coefficient.
Confounding Factors and Caveats
Several important caveats limit a straightforward causal interpretation. First, 2014 was a historically significant year for oil markets — WTI prices collapsed from ~$107/barrel in June to below $55 by year-end, driven by OPEC supply decisions and rising U.S. shale production. This secular price decline creates a time-trend confound: both variables may be responding independently to macroeconomic conditions (risk-off sentiment, volatility regimes) rather than influencing each other directly. Second, Tape B volumes specifically (covering NYSE American/AMEX-listed securities) may reflect sector-specific dynamics, including energy equities, which would naturally correlate with oil prices through a third variable — energy sector market activity. Third, the low-volume outlier cluster likely reflects non-trading days or partial sessions that should potentially be removed or treated separately before drawing strong conclusions. Finally, the Granger causality results with an optimal lag of only 2 periods may be too short to capture meaningful economic transmission mechanisms.
Actionable Insights and Further Investigation
Given these findings, several investigative paths are worth pursuing. First, decomposing the analysis by time period — splitting 2014 into pre- and post-June oil price crash — would test whether the correlation is driven primarily by the second-half collapse, potentially revealing a spurious or regime-specific relationship. Second, including volatility measures (e.g., VIX, oil implied volatility) as control variables would help disentangle whether it is oil price level or broader market uncertainty driving volume patterns. Third, investigating whether the low-volume outlier cluster corresponds to specific calendar dates (e.g., December holiday trading, early January) would improve data quality and regression reliability. Fourth, extending the Granger causality testing to longer lag structures (5–10 periods) and applying rolling window correlations could reveal whether any predictive relationship emerges over different horizons. Finally, comparing Tape B specifically against Tape A and Tape C volumes would clarify whether this oil–volume relationship is idiosyncratic to the securities listed on that exchange or a market-wide phenomenon.
X dataset: Cboe U.S. Equities Historical Market Volume Data 2014
Y dataset: WTI Crude Oil Prices: Daily (DCOILWTICO) – FRED St. Louis Fed (Daily)
Part of experiment: Daily - Cboe U.S. Equities Historical Market Volume Data 2014 vs WTI Crude Oil Prices: Daily (DCOILWTICO) – FRED St. Louis Fed (Daily)