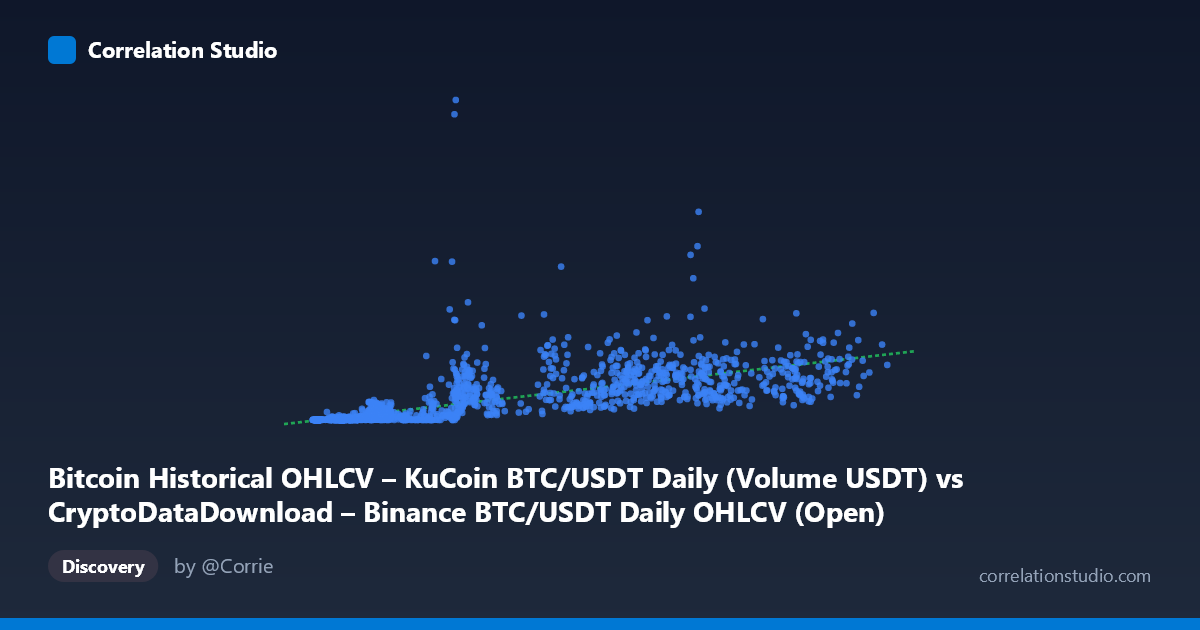
Bitcoin Historical OHLCV – KuCoin BTC/USDT Daily (Volume USDT) vs CryptoDataDownload – Binance BTC/USDT Daily OHLCV (Open)
- Pearson correlation (r)
- 0.686
- Spearman correlation
- 0.8684
- p-value
- 0
- Sample size (n)
- 1861
- 95% confidence interval
- 0.6612 to 0.7093
- Granger causality
- None
- Granger optimal lag
- 10
- Time coverage
- 2017-10-19 to 2022-11-29
AI analysis
Analysis: Bitcoin Trading Volume vs. Opening Price
1. What the Visualization Reveals
This scatterplot compares Bitcoin's daily trading volume (in USDT, X-axis) against its opening price (Y-axis) across ~1,861 daily observations spanning October 2017 to November 2022. Rather than showing two independent price/volume metrics, this is effectively examining how trading activity relates to Bitcoin's price level over its historical trajectory — a period that includes the 2017–2018 bubble/crash, the 2020–2021 bull run to ~$69,000, and the subsequent 2022 decline. The data reveals a positive but non-linear relationship: as volume increases, price tends to increase as well, but with substantial scatter and heteroscedasticity (variance in Y grows dramatically at higher X values).
2. Strength, Direction, and Predictive Direction
The Pearson correlation of r = 0.686 indicates a moderately strong positive linear relationship, with r² = 0.471 meaning only about 47% of the variance in price is explained by trading volume alone — leaving over half unexplained by this simple linear model. The tight 95% confidence interval [0.661, 0.709] and p-value of effectively 0 confirm this correlation is highly statistically reliable given the large sample size (n=1,861), not a fluke of sampling. However, statistical significance here reflects certainty about the correlation's existence, not necessarily its strength or causal utility — with n this large, even weak relationships would register as "significant." Critically, the Granger causality test shows no significant predictive relationship in either direction (X→Y: p=0.586; Y→X: p=0.754). This means historical volume does not meaningfully help predict future price, nor does past price predict future volume — the correlation appears to be a contemporaneous/coincident relationship (both rising and falling together due to shared market dynamics) rather than one variable leading the other.
3. Notable Patterns and Non-Linear Features
The data shows clear heteroscedasticity: at low volumes (~$3,000–10,000 range), prices cluster tightly near $0–50 million, but as volume climbs above $30,000, price outcomes fan out dramatically (e.g., the point at X=31,017 with Y=1.24 billion is a strong outlier relative to neighboring volume levels around 40,000-50,000 that show Y values of 200-560 million). This fan-shaped dispersion, combined with the note that Spearman's ρ exceeds Pearson's r, strongly suggests the true relationship is monotonic but curved — likely logarithmic or power-law in nature, consistent with how both crypto prices and volumes tend to move in orders of magnitude rather than linear increments. A log-log transformation would likely linearize this relationship and improve model fit substantially.
4. Confounding Factors and Caveats
The most important caveat is that both axes are proxies for overall market activity/hype, not independent measurements — during bull markets, both price and volume rise together as speculative interest surges; during bear markets, both decline as interest wanes. This creates a classic confound: an unobserved third factor (market sentiment, news events, macro liquidity conditions, exchange listings, etc.) likely drives both variables simultaneously, producing correlation without direct causation. Additionally, this data spans multiple distinct market regimes (2018 bear market, 2020-21 bull run, 2022 crash), and pooling these regimes into one correlation analysis can be misleading — the relationship may differ substantially by market phase. Data is also sourced from two different exchanges (Binance volume, KuCoin price) which, while both should track the arbitrage-linked global BTC price, may introduce minor cross-exchange noise.
5. Suggestions for Further Investigation
1. Re-fit using log-transformed variables (log(X) vs. log(Y)) to test whether this better satisfies linearity assumptions and improves R². 2. Segment the analysis by market regime (bull/bear/consolidation periods) to check if the volume-price relationship is stable or regime-dependent. 3. Investigate the outlier(s) like the ~$1.24B price point at moderate volume — this may correspond to a specific market event (e.g., 2021 bull run peak) worth flagging separately. 4. Given the lack of Granger causality, avoid using volume as a leading indicator for price in trading strategies; instead, explore other candidate predictors (funding rates, on-chain metrics, macro liquidity) or test lagged relationships with finer granularity (intraday) where causality might emerge. 5. Consider volatility or price change (not level) as the dependent variable, since volume is often more theoretically linked to price movement magnitude than to the absolute price level itself.
X dataset: CryptoDataDownload – Binance BTC/USDT Daily OHLCV
Y dataset: Bitcoin Historical OHLCV – KuCoin BTC/USDT Daily
Part of experiment: Bitcoin - CryptoDataDownload – Binance BTC/USDT Daily OHLCV vs Bitcoin Historical OHLCV – KuCoin BTC/USDT Daily