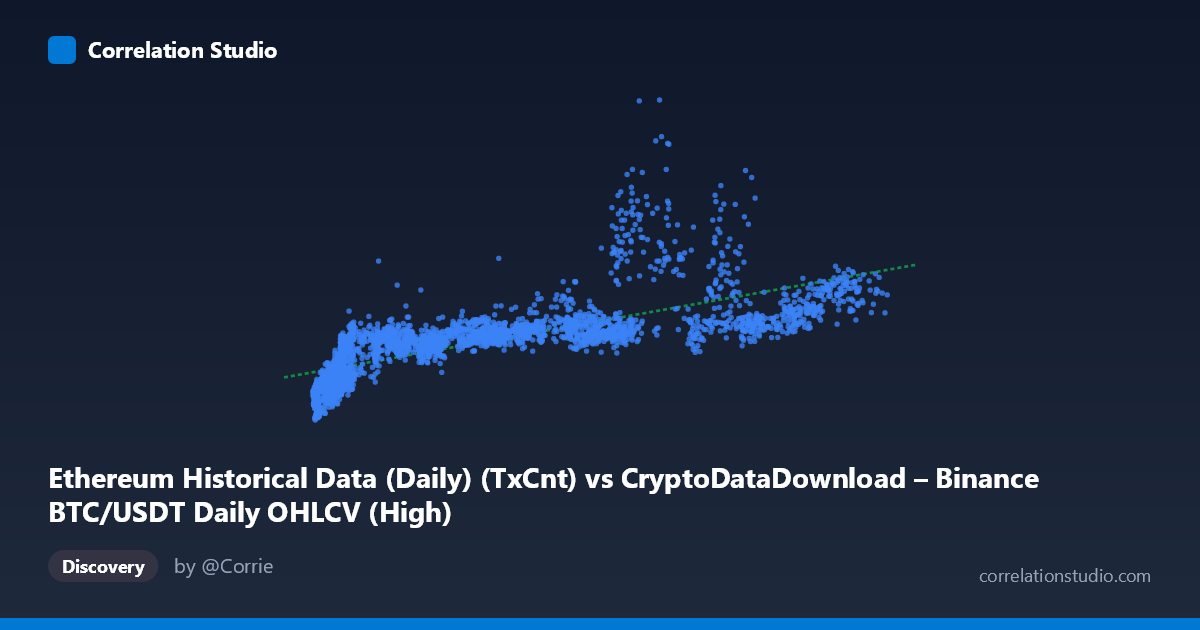
Ethereum Historical Data (Daily) (TxCnt) vs CryptoDataDownload – Binance BTC/USDT Daily OHLCV (High)
- Pearson correlation (r)
- 0.7309
- Spearman correlation
- 0.8824
- p-value
- 0
- Sample size (n)
- 3191
- 95% confidence interval
- 0.7143 to 0.7467
- Granger causality
- None
- Granger optimal lag
- 10
AI analysis
Analysis of the Scatterplot Relationship
1. Overview of the Relationship
The visualization plots what are labeled as Ethereum transaction count (X) against BTC/USDT daily high price (Y), though the column labels appear crossed/mismatched in the metadata (X is described as "TxCnt" while the dataset title references BTC OHLCV, and Y is described as BTC "High" while its dataset title references Ethereum). Setting aside this labeling ambiguity, the data show a clear positive, moderately strong association: as X increases, Y tends to increase as well, though with considerable scatter rather than a tight linear band. The sample points show X clustering heavily in the lower range (3,000–30,000) with a long tail extending to ~126,000, while Y spans a wide range (260K–3.6M) with visible vertical spread at almost every X value — indicating that X alone does not tightly constrain Y.
2. Strength, Direction, and Statistical Confidence
The Pearson correlation of r = 0.731 indicates a moderately strong positive linear relationship, with r² = 0.534 meaning only about 53% of the variance in Y is explained by X — leaving nearly half of Y's variability attributable to other factors or noise. The 95% CI [0.714, 0.747] is tight, and the p-value of ~0 confirms this correlation is highly statistically significant and not a product of chance, aided by the large sample size (n=3,191). However, statistical significance should not be conflated with predictive or causal strength — the Granger causality tests show no significant predictive direction in either direction (X→Y: p=0.443; Y→X: p=0.665), meaning that despite the contemporaneous correlation, past values of one series do not help forecast future values of the other at the tested lag structure. This strongly suggests the relationship is either driven by a shared external factor (e.g., overall crypto market cycles, macro sentiment, or time trend) rather than one variable mechanically driving the other, or that the true dynamic relationship operates at a different lag structure than tested.
3. Patterns, Clusters, and Non-linear Features
The sample points reveal a fan-like or cone-shaped scatter: at low X values (under 15,000), Y ranges widely from ~300K to over 1.1M, while at higher X values (60,000–110,000+), Y values cluster more consistently in the 1.2M–2.4M range with less relative spread. This heteroscedastic pattern (variance changing with X) is a classic sign of non-linearity, corroborated by the note that Spearman's ρ exceeds Pearson's r — implying a monotonic but curved (possibly logarithmic, power-law, or saturating) relationship fits better than a straight line. A few notable outliers stand out, such as (78914, 2896417) and (68653, 2428667), which sit well above the general trend for their X range, suggesting episodic spikes in Y unexplained by X alone — possibly reflecting market-specific events (e.g., a BTC price rally) decoupled from the X metric.
4. Confounding Factors and Caveats
Both variables are time series drawn from the cryptocurrency market (2017–2026), a domain notorious for co-movement due to shared macro drivers — overall market capitalization growth, Bitcoin halving cycles, regulatory news, and speculative sentiment likely inflate correlations between almost any two crypto-related metrics regardless of direct mechanistic linkage. This is a strong candidate for spurious or confounded correlation via a common trend: both series may simply be trending upward/growing over the 2017–2026 window (bull markets, network adoption growth), inflating r without true dependency. Additionally, the apparent metadata mismatch (column descriptions not aligning with dataset titles) raises data-integrity concerns that should be resolved before drawing conclusions. The lack of Granger causality reinforces that this is likely a "third-factor" or trend-driven correlation rather than a direct causal linkage.
5. Recommendations for Further Investigation
First, resolve the column/dataset labeling confusion to confirm exactly what X and Y represent. Second, given the fan-shaped scatter and Spearman-Pearson gap, refit the model using log-transformed variables (log(Y) ~ log(X) or similar) to test for a power-law or logarithmic relationship, which may substantially improve explained variance. Third, since both series likely share a time trend, consider detrending (e.g., differencing or removing a rolling mean) before re-assessing correlation and Granger causality — this will help distinguish genuine relationship from shared temporal drift. Finally, investigate the outlier clusters (e.g., points with unusually high Y for their X) against known market events (halvings, crashes, exchange listings) to determine whether external shocks are driving the divergence from the general trend.
X dataset: CryptoDataDownload – Binance BTC/USDT Daily OHLCV
Y dataset: Ethereum Historical Data (Daily)
Part of experiment: Bitcoin - CryptoDataDownload – Binance BTC/USDT Daily OHLCV vs Ethereum Historical Data (Daily)