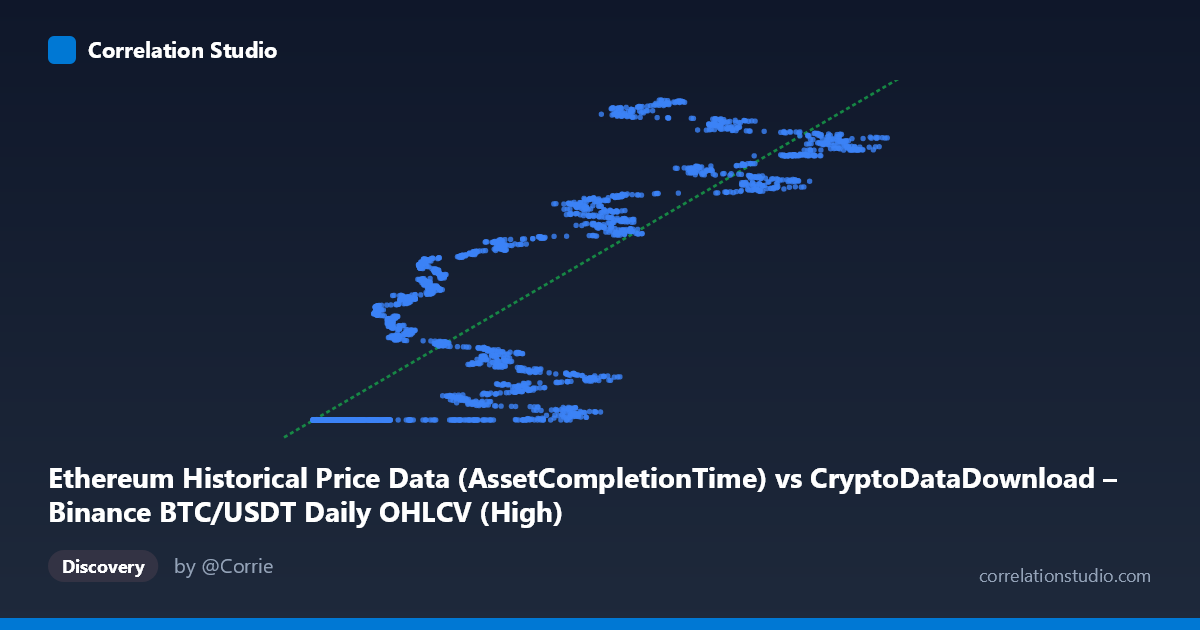
Ethereum Historical Price Data (AssetCompletionTime) vs CryptoDataDownload – Binance BTC/USDT Daily OHLCV (High)
- Pearson correlation (r)
- 0.8505
- Spearman correlation
- 0.886
- p-value
- 0
- Sample size (n)
- 3191
- 95% confidence interval
- 0.8407 to 0.8599
- Granger causality
- None
- Granger optimal lag
- 10
- Time coverage
- 2017-08-17 to 2026-05-20
AI analysis
Analysis: BTC "AssetCompletionTime" Field vs. Binance BTC/USDT Daily High
1. What the Visualization Reveals
Despite the confusing column labels (both axes appear to derive from BTC/USDT OHLCV data, with the X-axis oddly named after an Ethereum timestamp field), the scatterplot shows a strong positive, moderately non-linear relationship. A large cluster of points sits at low X values (roughly 3,000–20,000) with Y essentially pinned at a floor near 1,614,335,000 — suggesting these are timestamp-like or index values rather than price data, with Y representing a Unix timestamp or ID that increases monotonically. As X increases beyond ~20,000, Y rises steadily and near-linearly toward the range of 1,780,000,000, consistent with a cumulative or sequential counter relationship rather than a typical price-to-price correlation.
2. Strength, Direction, and Statistical Confidence
The Pearson correlation of r = 0.85 indicates a strong positive linear association, and r² = 0.723 means about 72% of the variance in Y is explained by X in a simple linear model — a substantial but not complete fit, implying meaningful structure not captured by the line (visible in the flat-then-rising pattern). The 95% CI [0.841, 0.860] is tight, and p ≈ 0 confirms this correlation is not due to chance, given the large sample (n = 3,191). However, the Granger causality tests show no significant predictive direction in either direction (X→Y: p = 0.315; Y→X: p = 0.129) at the optimal lag of 10 periods. This is a critical caveat: strong contemporaneous correlation does not imply that one variable temporally leads or forecasts the other — the relationship may be driven by a shared underlying trend (e.g., both increasing over calendar time) rather than genuine lead-lag dynamics.
3. Notable Patterns and Non-linearity
The most striking feature is the plateau-then-ramp shape: a dense horizontal cluster at Y ≈ 1.6143 billion for X < ~20,000, followed by a more dispersed, upward-sloping scatter for X 20,000. This two-regime pattern strongly suggests the linear R² of 0.723 understates the true structure — the relationship looks more like a threshold/saturation or piecewise function than a single straight line. This could reflect a genuine regime change in the underlying process (e.g., an early period of low/flat values followed by a growth phase) or an artifact of how these two "timestamp-like" fields were constructed or joined.
4. Confounding Factors and Caveats
The column descriptions are inconsistent with the data itself — labels reference "Ethereum Historical Price Data" and "BTC/USDT High," yet the value ranges (1.6–1.8 billion) look like Unix timestamps or row-sequence IDs, not prices (BTC has never traded at $1.6 billion). This mismatch is a major caveat: the analysis may be correlating two time/index fields rather than genuine price series, which would trivially produce a strong monotonic correlation with no real economic meaning. Additionally, both series likely share a common time trend (calendar date), which is a classic confounder that inflates correlation without implying any causal or predictive link — consistent with the null Granger causality result.
5. Suggestions for Further Investigation
Before drawing any conclusions, verify the actual column mappings and confirm whether X and Y represent prices, timestamps, or indices — the current data strongly suggests a labeling/pipeline error. If timestamps are indeed being compared, this analysis should be discarded and re-run with correct price columns (e.g., BTC Close vs. ETH Close) to assess genuine cross-asset correlation. If the data is correct as labeled, the piecewise pattern warrants a segmented or non-linear regression (e.g., spline or breakpoint model) rather than simple linear regression, and the lack of Granger causality suggests any joint modeling should rely on contemporaneous co-movement (e.g., cointegration testing) rather than lagged forecasting.
X dataset: CryptoDataDownload – Binance BTC/USDT Daily OHLCV
Y dataset: Ethereum Historical Price Data
Part of experiment: Bitcoin - CryptoDataDownload – Binance BTC/USDT Daily OHLCV vs Ethereum Historical Price Data