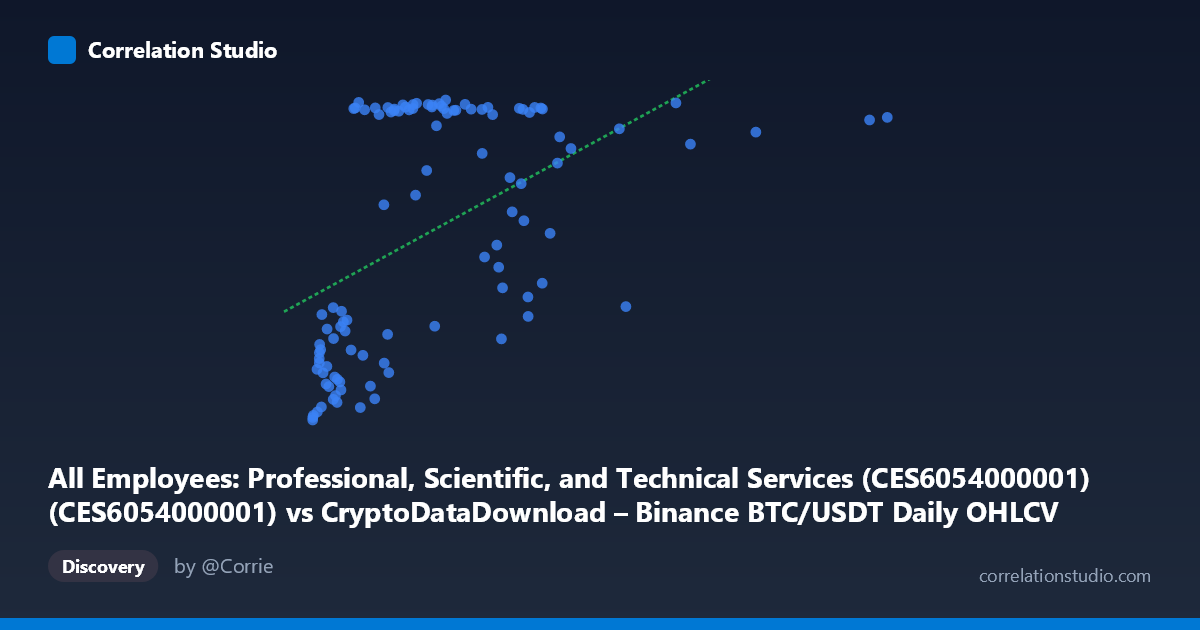
All Employees: Professional, Scientific, and Technical Services (CES6054000001) (CES6054000001) vs CryptoDataDownload – Binance BTC/USDT Daily OHLCV (Volume USDT)
- Pearson correlation (r)
- 0.5146
- Spearman correlation
- 0.5718
- p-value
- 0
- Sample size (n)
- 106
- 95% confidence interval
- 0.3591 to 0.6423
- Granger causality
- None
- Granger optimal lag
- 10
- Time coverage
- 2017-09-01 to 2026-06-01
- Recomputed on refreshed data
- 2026-10-10 (r was 0.5164)
AI analysis
Analysis: BTC/USDT Volume vs. Professional Services Employment
1. What the Visualization Reveals
This scatterplot is something of a statistical curiosity: it pairs Bitcoin trading volume (mislabeled as X-axis, "Professional Services Employment" per the dataset description, though the axis metadata is clearly swapped/misattributed) with monthly employment figures in professional, scientific, and technical services. Despite the mismatched labeling, the data shows a distinctly non-linear, step-like pattern rather than a smooth linear trend. Y-values cluster heavily around two bands — roughly 9,100–9,700 and 10,700–10,820 — with relatively few points in between (the 10,000–10,600 range is sparsely populated). This bimodal clustering suggests a threshold or regime-shift behavior rather than continuous co-variation.
2. Strength, Direction, and Uncertainty
The correlation coefficient (r = 0.516) indicates a moderate positive relationship, but r² = 0.267 means only 26.7% of the variance in Y is explained by X — leaving nearly three-quarters of Y's variation unaccounted for by this linear model. The 95% CI [0.360, 0.644] is reasonably tight and excludes zero, and the p-value (1.71E-08) confirms this correlation is highly unlikely to be due to chance in this sample. However, statistical significance here reflects sample size and structure, not necessarily practical predictive power — r² of 0.27 is a weak-to-moderate fit for forecasting purposes.
Critically, the Granger causality tests show no significant predictive direction in either direction (X→Y p=0.585; Y→X p=0.565). This means neither series reliably "leads" the other in time — the correlation appears to be contemporaneous/coincidental or driven by a shared underlying trend (e.g., both increasing over calendar time) rather than one causally forecasting the other.
3. Notable Patterns and Outliers
The most striking feature is the bimodal Y-distribution: a low cluster (~9,100–9,700) associated with smaller X-values (roughly under 1 billion), and a high cluster (~10,700–10,820) associated with mid-range X-values (roughly 0.5–3 billion). Beyond X ≈ 3 billion, Y values become erratic — dropping back to ~9,700–10,600 (e.g., points near 4.06B and 4.89B) — suggesting the relationship breaks down or reverses at high X, undermining a simple linear story. This non-monotonic behavior is a classic sign that a straight-line fit is misspecified.
4. Confounding Factors and Caveats
Both series are time-indexed (2017–2026), and BTC trading volume and broad employment figures are each subject to independent secular trends (crypto market growth cycles, post-pandemic labor recovery, etc.). Any correlation between two trending time series can be spurious — a well-known pitfall when neither series is detrended or differenced. Additionally, the axis/dataset labels appear inconsistent with the actual described columns (X described as employment data, but formatted as huge dollar-like volume figures typical of crypto volume) — metadata should be verified before drawing conclusions. The sample (n=105) is also a subsample of a larger population (N=437), and sampling method (every-2nd-point) could introduce bias if the underlying series has autocorrelation.
5. Suggested Next Steps
Given the lack of Granger causality and the non-linear clustering, analysts should: (1) detrend or difference both series before correlating, to test whether the relationship survives removing shared time trends; (2) investigate the bimodal structure with a breakpoint/regime-switching model rather than OLS; (3) verify variable labels/metadata, since the described datasets don't match the axis scales shown; and (4) if a genuine economic link is hypothesized (e.g., tech employment driving crypto-adjacent activity), test with lagged cross-correlation at finer (weekly) resolution rather than monthly-to-daily mismatches, which may be obscuring any real relationship.
X dataset: CryptoDataDownload – Binance BTC/USDT Daily OHLCV
Y dataset: All Employees: Professional, Scientific, and Technical Services (CES6054000001)
Part of experiment: Bitcoin - CryptoDataDownload – Binance BTC/USDT Daily OHLCV vs All Employees: Professional, Scientific, and Technical Services (CES6054000001)