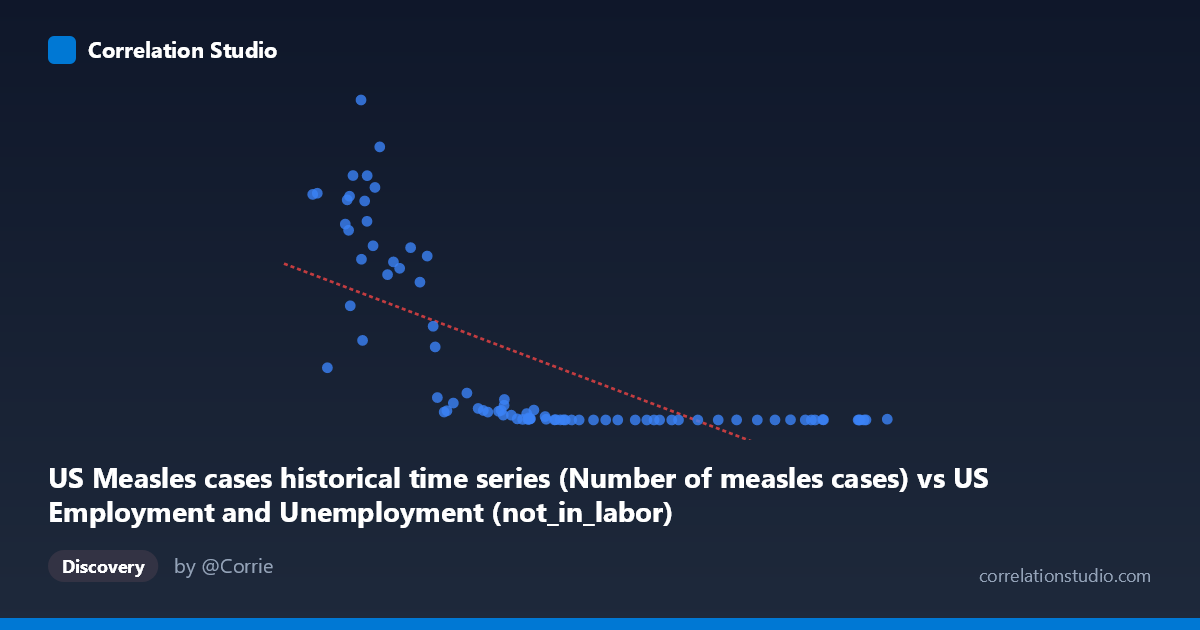
US Measles cases historical time series (Number of measles cases) vs US Employment and Unemployment (not_in_labor)
- Pearson correlation (r)
- -0.6886
- Spearman correlation
- -0.9124
- p-value
- 0
- Sample size (n)
- 85
- 95% confidence interval
- -0.7863 to -0.5573
- Granger causality
- None
- Granger optimal lag
- 10
AI analysis
Scatterplot Analysis: US Measles Cases vs. Not-in-Labor-Force
1. What the Visualization Reveals
The scatterplot displays a striking inverse relationship between historical US measles case counts (X-axis) and the number of Americans not in the labor force (Y-axis), spanning data from 1941 to 2025. The pattern is visually dramatic: when measles cases are low (concentrated below ~65,000), the not-in-labor-force population spans an enormous range from near-zero to nearly 900,000, while higher measles case counts are associated with consistently low not-in-labor-force values. The data does not distribute evenly along a straight line — instead, there is a pronounced hyperbolic or exponential decay shape, with a dense cluster of points at low X values showing extreme Y variability, and a compressed cluster at high X values hugging near zero on the Y-axis.
2. Correlation Strength, Direction, and Statistical Framing
The Pearson correlation of r = -0.689 indicates a moderately strong negative linear association, but the R² of 0.474 means that only about 47.4% of the variance in not-in-labor-force counts is statistically explained by measles case numbers — leaving more than half the variance unexplained by this linear model alone. The 95% confidence interval of [-0.786, -0.557] is entirely negative and reasonably tight, confirming directional consistency, and the p-value of 3.26 × 10⁻¹³ makes this correlation highly statistically significant — the probability of observing this by chance under a null hypothesis of no relationship is vanishingly small. However, the Granger causality analysis tells a critically important story: neither direction (X→Y nor Y→X) achieves significance at the optimal lag of 10 periods (F = 1.51, p = 0.161 and F = 1.60, p = 0.131 respectively). This means that neither variable temporally predicts the other — there is no evidence of a causal or even predictive temporal pathway in either direction, which strongly cautions against any causal interpretation of the correlation. Notably, the hint that Spearman ρ exceeds Pearson r confirms the relationship is better described as non-linear, and a logarithmic or power-law model would likely improve the R² substantially beyond 47.4%.
3. Notable Patterns, Clusters, and Outliers
Several structural features stand out: - Left-side cluster (X < ~55,000): A dense concentration of points with extremely high Y values (some exceeding 600,000–894,000), showing enormous vertical spread. This represents the pre-vaccine era (roughly 1941–1963) when measles was endemic and labor force composition was fundamentally different. - Middle transition zone (X ~ 55,000–70,000): Y values drop sharply and non-linearly, consistent with an exponential decay rather than a linear slope. - Right-side cluster (X ~70,000): Points collapse tightly near zero on the Y-axis, with very low not-in-labor-force values and minimal variance — this likely corresponds to the post-vaccine, near-elimination era. - Apparent outliers: The point at approximately (43,990; 894,134) stands out as the highest Y value, and points like (38,590; 630,291) and (46,088; 763,094) represent extreme observations that likely exert high leverage on the linear regression. The point at (102,846; 2,288) is the rightmost observation but with an unexpectedly non-trivial Y value.
4. Confounding Factors and Critical Caveats
This correlation is almost certainly a textbook example of a spurious time-series correlation driven by a shared temporal trend rather than any meaningful mechanistic relationship. Both variables are primarily functions of time: - Measles cases declined dramatically following the introduction of the measles vaccine in 1963 and subsequent immunization campaigns. - Not-in-labor-force counts reflect decades of demographic, economic, and social changes — population growth, aging Baby Boomers, changing female labor participation, disability classification, and retirement patterns.
Both series trend in opposite directions over the same historical period, producing a mathematical correlation that reflects nothing more than coincident long-term trends. Additional confounders include population growth (larger denominator affecting both series differently), changes in BLS measurement methodology, and the fact that the X and Y axis labels appear to have their dataset sources swapped (measles data labeled as employment data and vice versa), raising data integrity concerns that should be verified before any further analysis. The non-significant Granger results reinforce that no predictive temporal signal exists between these variables.
5. Actionable Insights and Further Investigation
- Apply a logarithmic transformation to Y (not-in-labor-force) before regression, given the strong non-linearity suggested by the hyperbolic scatter pattern and the Spearman Pearson finding. This would likely yield a substantially higher adjusted R² and more reliable residuals. - Detrend both time series using first-differencing or HP filtering to remove the shared secular trend before computing correlations — this is the essential methodological step to test whether any residual relationship exists beyond coincident historical timing. - Verify the dataset column assignments, as the axis labels suggest a possible column swap between the two source datasets, which would undermine all interpretations. - Segment the analysis by era (pre-1963, 1963–1980, post-1980) to examine whether the correlation structure changes across the vaccine introduction period, which could reveal more nuanced within-period dynamics. - Conduct a proper spurious regression test (e.g., Engle-Granger cointegration test) to formally assess whether any long-run equilibrium relationship exists, or whether this is purely a case of two independent I(1) processes generating a misleading correlation.
X dataset: US Employment and Unemployment
Y dataset: US Measles cases historical time series
Part of experiment: Yearly - US Employment and Unemployment vs US Measles cases historical time series