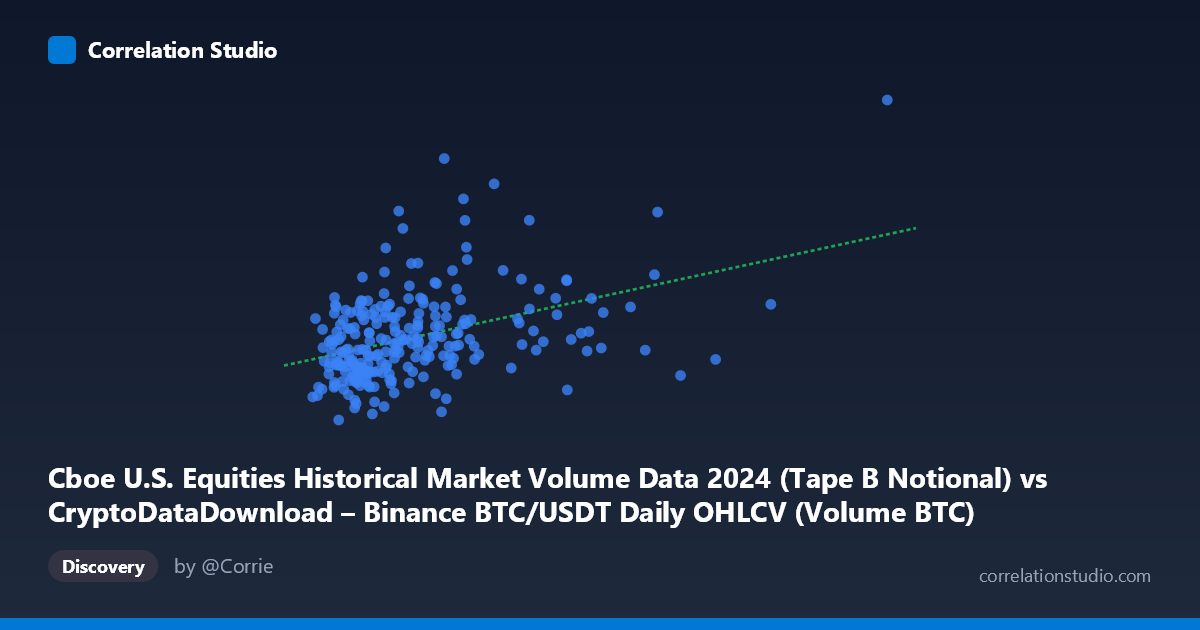
Cboe U.S. Equities Historical Market Volume Data 2024 (Tape B Notional) vs CryptoDataDownload – Binance BTC/USDT Daily OHLCV (Volume BTC)
- Pearson correlation (r)
- 0.414
- Spearman correlation
- 0.3868
- p-value
- 0
- Sample size (n)
- 252
- 95% confidence interval
- 0.3061 to 0.5114
- Granger causality
- None
- Granger optimal lag
- 10
AI analysis
Analysis: Cboe U.S. Equities Volume vs. Binance BTC/USDT Volume (2024)
1. What the Visualization Reveals
The scatterplot shows a modest positive relationship between the two variables: as the X variable (labeled as Cboe equities notional volume, though the data appears to actually represent Binance BTC/USDT trading volume based on the ranges) increases, Y tends to increase as well, but the relationship is loose and noisy. The vast majority of points cluster tightly in the lower-left region (X between 20,000–55,000; Y between ~4B–8B), while a single extreme outlier at (162,065.59, 14.37B) sits far outside this cluster and likely exerts significant leverage on the fitted regression line.
2. Strength, Direction, and Statistical Confidence
The correlation coefficient (r = 0.414) indicates a weak-to-moderate positive relationship. Critically, r² = 0.171 tells us that only 17.1% of the variance in Y is explained by X — meaning over 82% of the variability in Y is driven by other factors entirely unrelated to X in this model. The 95% confidence interval [0.306, 0.511] is reasonably tight and does not cross zero, and the p-value (7.4E-12) is highly significant, confirming this correlation is not due to random chance in this sample. However, statistical significance should not be conflated with practical strength — this is a real but weak association.
The Granger causality results are particularly important: neither direction (X→Y or Y→X) shows significant predictive power (p = 0.794 and p = 0.867, respectively, at 10 lags). This strongly suggests that whatever contemporaneous correlation exists, one variable does not temporally lead or forecast the other. This is consistent with the two series being driven by a shared external factor (e.g., overall market activity, volatility regimes, or macro conditions) rather than one causing the other.
3. Notable Patterns and Outliers
The single point at (162,065.59, 14.37B) is a substantial outlier in both dimensions — it's roughly 3x the next-highest X value and nearly double the Y mean. This point alone could be inflating both the correlation coefficient and the regression slope; removing it would likely reduce r² further, suggesting the "true" relationship in the bulk of the data (X < 90,000) is even weaker than reported. Within the main cluster, there's no clear non-linear curvature (e.g., logarithmic saturation) — the relationship looks fairly diffuse/cloud-like rather than a clean linear trend, consistent with the low r².
4. Confounding Factors and Caveats
Several caveats apply: (1) the metadata labels are inconsistent/possibly mismatched (X is described as Cboe notional volume but ranges like a BTC volume metric, and Y is described as "Volume BTC" but has values in the billions, inconsistent with typical BTC unit counts) — this raises data-provenance concerns that should be resolved before drawing firm conclusions. (2) Both series are time-series data from the same calendar year, so they may share common confounds like overall market volatility, macroeconomic risk-on/risk-off sentiment, or trading holidays/weekends, which could create spurious correlation without direct causal linkage. (3) The single large outlier point could disproportionately drive the r and r² estimates — a leverage/influence check (e.g., Cook's distance) is warranted.
5. Actionable Recommendations
1. Verify data labeling/units — confirm which column truly represents which market and unit (BTC volume vs. USD notional) to ensure the analysis is economically meaningful. 2. Re-run correlation excluding the outlier to test robustness; report both results. 3. Test for a common driver — e.g., include a volatility index (VIX) or overall crypto market cap as a control variable, or run a partial correlation. 4. Given the null Granger result, do not use one series to forecast the other in a trading or predictive model; instead, treat any comovement as coincidental or jointly-driven rather than causal. 5. Consider non-linear or rank-based correlation (Spearman) given the skewed distribution and outlier, to check if the Pearson r is being distorted by extreme values.
X dataset: CryptoDataDownload – Binance BTC/USDT Daily OHLCV
Y dataset: Cboe U.S. Equities Historical Market Volume Data 2024
Part of experiment: Bitcoin - CryptoDataDownload – Binance BTC/USDT Daily OHLCV vs Cboe U.S. Equities Historical Market Volume Data 2024