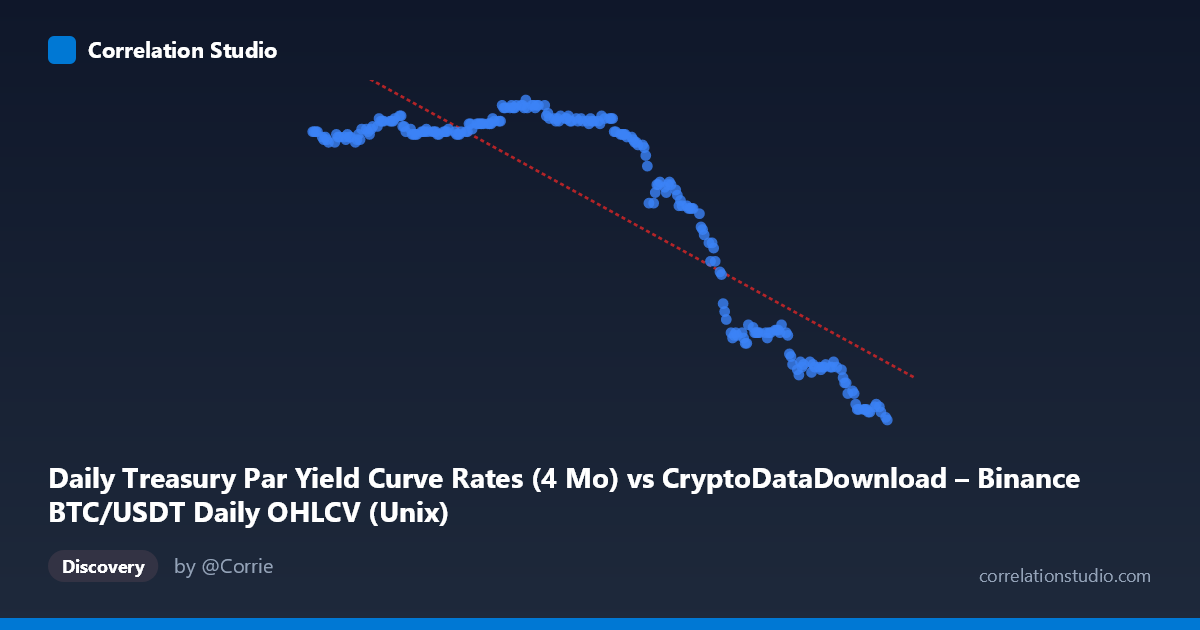
Daily Treasury Par Yield Curve Rates (4 Mo) vs CryptoDataDownload – Binance BTC/USDT Daily OHLCV (Unix)
- Pearson correlation (r)
- -0.862
- Spearman correlation
- -0.7258
- p-value
- 0
- Sample size (n)
- 250
- 95% confidence interval
- -0.8908 to -0.8263
- Granger causality
- None
- Granger optimal lag
- 1
AI analysis
Analysis: Treasury 4-Month Yield vs. Time-Indexed Series (Labeled as BTC/USDT)
Note on data labeling: The axis labels appear swapped or mismatched in the metadata — the X-axis is described as Treasury yield data while containing Unix timestamps, and Y-axis is described as OHLCV data while containing values in the 4.3–5.5 range typical of short-term interest rates. This analysis treats X as a time index (Jan–Dec 2024) and Y as the 4-month Treasury par yield, which matches the actual data pattern.
1. Relationship Overview The scatterplot shows a clear downward-sloping relationship between time and the 4-month Treasury yield across 2024. Yields start near 5.4–5.5% in January, hold relatively steady through mid-year, and then decline steadily from roughly August onward, ending near 4.3–4.4% by late December. This is consistent with the Federal Reserve's rate-cutting cycle that began in September 2024.
2. Strength, Direction, and Statistical Confidence The correlation is strong and negative (r = -0.862), with r² = 0.743 indicating that time (as a linear trend) explains about 74% of the variance in yield levels — a substantial but not complete fit, implying meaningful non-linear structure remains (see below). The 95% CI [-0.891, -0.826] is tight and does not cross zero, and the p-value is effectively 0, so we can be highly confident this negative association is not due to chance sampling. However, the Granger causality tests show no significant predictive direction in either direction (X→Y: p=0.90; Y→X: p=0.59). This is expected and appropriate here: time cannot be "caused" by yield or vice versa in a meaningful forecasting sense — the strong correlation simply reflects a shared trend over the sample period, not a dynamic causal or lead-lag relationship between two interacting variables.
3. Notable Patterns and Non-linearities The relationship is clearly not linear — it resembles a step/plateau function rather than a straight line. Yields are relatively flat and high (~5.4–5.5%) from January through July, then drop in a more accelerated fashion from August through December, with the steepest decline appearing between September and November. This creates two or three visible "clusters" in the scatter (a high plateau, a transition zone, and a lower plateau near year-end) rather than a uniform linear decay. A linear regression captures the overall downward drift but understates the flat regions and overstates the rate of change during the plateaus, while understating it during the transition period.
4. Confounding Factors and Caveats Since X is essentially a time index, this correlation reflects a trend-in-time, not a substantive bivariate relationship between two independent economic variables. Any macro variable that moved in one direction over 2024 (equity indices, other short-term rates, inflation prints) would show a similarly strong correlation with time. The apparent "relationship" is therefore driven entirely by the Fed's policy cycle and calendar-time autocorrelation, not by an underlying causal mechanism linking X and Y as described in the metadata. The mismatch between the stated dataset columns (crypto OHLCV vs. Treasury rates) also raises data-integrity concerns that should be resolved before drawing further conclusions.
5. Recommendations for Further Investigation - Clarify and correct the axis/column labels — verify which dataset actually populated the X and Y columns, since the current labels appear inconsistent with the data ranges. - If the intent was to compare BTC/USDT price with Treasury yields, re-run the analysis using actual BTC closing prices against yield values (not against a timestamp) to test for a genuine cross-asset relationship (e.g., risk-on/risk-off dynamics between crypto and rates). - Model yield as a function of time using a piecewise or spline regression rather than simple linear regression, given the plateau-transition-plateau structure, to better capture the rate-cut timeline. - Use rate-of-change or first-differenced series if testing for genuine Granger causality between BTC and yields, since both series may be non-stationary in levels, which can distort causality test results.
X dataset: CryptoDataDownload – Binance BTC/USDT Daily OHLCV
Y dataset: Daily Treasury Par Yield Curve Rates
Part of experiment: Bitcoin - CryptoDataDownload – Binance BTC/USDT Daily OHLCV vs Daily Treasury Par Yield Curve Rates