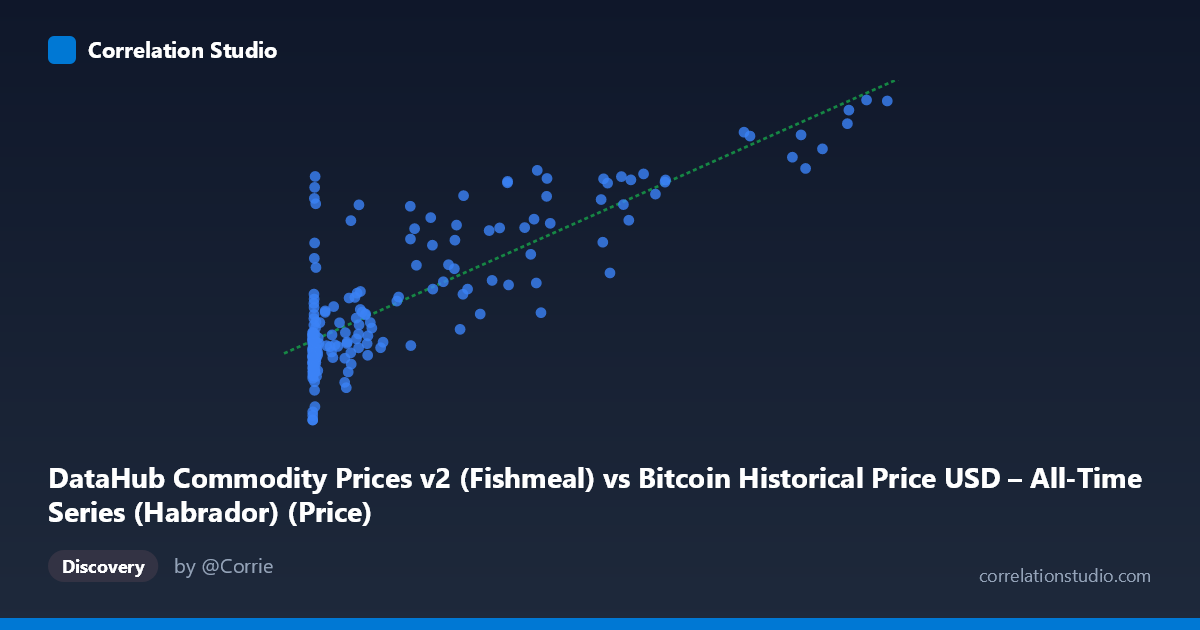
DataHub Commodity Prices v2 (Fishmeal) vs Bitcoin Historical Price USD – All-Time Series (Habrador) (Price)
- Pearson correlation (r)
- 0.8284
- Spearman correlation
- 0.7388
- p-value
- 0
- Sample size (n)
- 182
- 95% confidence interval
- 0.7765 to 0.8691
- Granger causality
- None
- Granger optimal lag
- 4
AI analysis
Analysis: Bitcoin Price vs. Fishmeal Commodity Price
1. What the Visualization Reveals
The scatterplot shows a strong positive relationship between the two variables, but the underlying mechanics are almost certainly not causal in the economically meaningful sense—this is a spurious correlation driven by shared temporal trends. Both series appear to be monotonically increasing over the 2010–2025 window (Bitcoin's well-documented multi-cycle bull run, and fishmeal's steady price inflation), so plotting them against each other produces an apparent linear relationship that reflects "time" as a lurking common factor rather than any direct economic link between fish protein feedstock prices and cryptocurrency valuations.
2. Strength, Direction, and Uncertainty
The correlation is strong and positive (r = 0.83, r² = 0.686), meaning roughly 69% of the variance in Y (fishmeal price, per the axis labeling) is statistically associated with X (Bitcoin price). The 95% CI [0.777, 0.869] is tight and the p-value is effectively 0, so the correlation is highly unlikely to be a sampling artifact — it's a robust statistical pattern in this dataset. However, statistical significance here should not be confused with practical/causal significance. Critically, the Granger causality tests show no significant predictive direction in either direction (X→Y: p=0.32; Y→X: p=0.61). This is the key finding: despite the strong contemporaneous correlation, neither series helps forecast the other's future values beyond its own history. This strongly supports the interpretation that both variables are independently trending upward over time rather than one driving the other.
3. Notable Patterns and Outliers
The data is heavily right-skewed on the X-axis (Bitcoin spans from $0.06 to $113,500, with mean 17,943 but stdev 27,080 — far exceeding the mean, confirming extreme skew). Most points cluster at low X values (<1000), corresponding to Bitcoin's early years, with Y values compressed in the 150–200 range. As X increases into the tens of thousands, Y rises to 250–310. This pattern looks less like a clean linear relationship and more like two logarithmic/exponential growth curves that happen to line up temporally. The extreme leverage points (X 90,000, e.g., 105620→298.26, 97365→276.23) likely have outsized influence on the regression slope; a log-transform of X would probably reveal a more genuinely linear (or even saturating) relationship and improve model diagnostics.
4. Confounding Factors and Caveats
The dominant confound is time itself. Both Bitcoin price and commodity/fishmeal prices have experienced long-run inflationary and speculative growth over the 2010–2025 period (Bitcoin due to adoption cycles and halving events; fishmeal due to feed demand, El Niño supply shocks, and general commodity inflation/USD debasement). Any two upward-trending time series will show spurious correlation. Additional caveats: the relationship is almost certainly non-stationary (both series likely have unit roots), which inflates r² in raw-level regressions — a classic textbook case for why Granger causality (run on the actual data properly, likely differenced) is essential and here correctly shows no causal link. The mismatched "N=429 vs n=182" also suggests substantial missing/misaligned data requiring interpolation or subsetting, which can distort correlation estimates.
5. Actionable Insights
This correlation should not be used for trading, hedging, or forecasting one asset from the other — the Granger results confirm there's no exploitable lead-lag relationship. For legitimate analysis: (a) difference or log-transform both series and re-run correlation/Granger tests to check if the relationship survives detrending (it likely won't, confirming spuriousness); (b) if a genuine link is hypothesized (e.g., through inflation, USD strength, or risk-on sentiment), consider a third common factor like DXY, CPI, or global M2 money supply as a mediating variable; (c) treat this pairing primarily as a cautionary example in a broader dataset audit — mismatched/unrelated series (crypto price vs. fish feed commodity) being paired suggests reviewing the data pipeline for accidental column misalignment between the two source datasets.
X dataset: Bitcoin Historical Price USD – All-Time Series (Habrador)
Y dataset: DataHub Commodity Prices v2
Part of experiment: Bitcoin - Bitcoin Historical Price USD – All-Time Series (Habrador) vs DataHub Commodity Prices v2