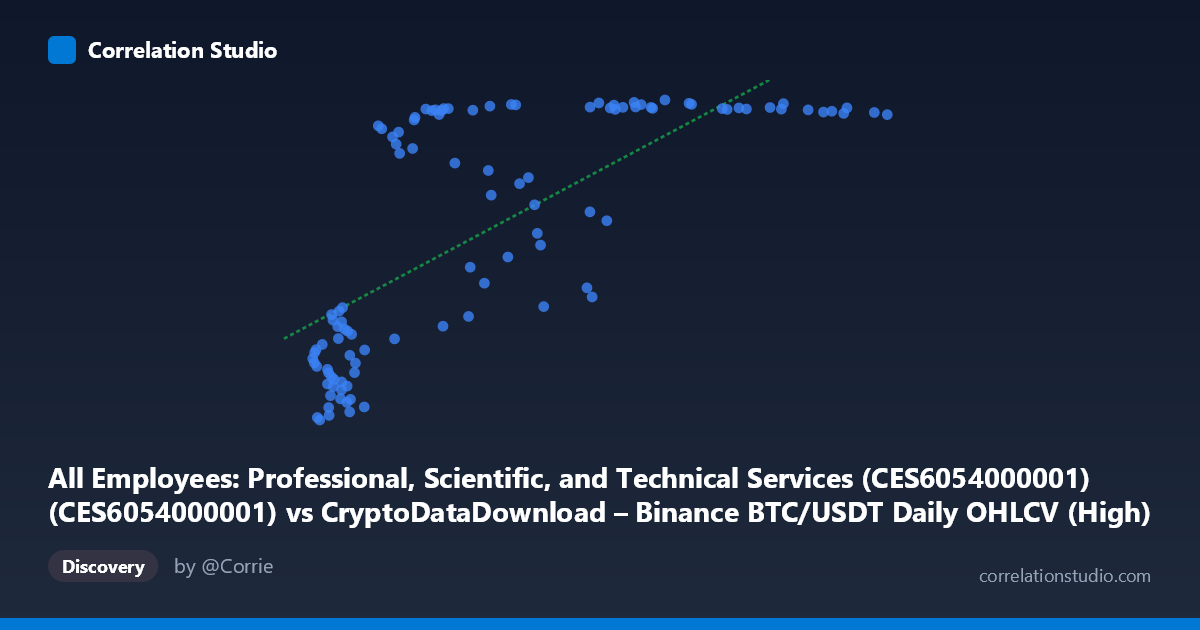
All Employees: Professional, Scientific, and Technical Services (CES6054000001) (CES6054000001) vs CryptoDataDownload – Binance BTC/USDT Daily OHLCV (High)
- Pearson correlation (r)
- 0.7258
- Spearman correlation
- 0.8074
- p-value
- 0
- Sample size (n)
- 106
- 95% confidence interval
- 0.6211 to 0.8051
- Granger causality
- None
- Granger optimal lag
- 10
AI analysis
Analysis of Relationship Between Variables
Note on labeling: The axis labels appear swapped in the metadata (X is described as employment data, Y as BTC price), but the actual value ranges make clear that X is BTC/USDT price-like data (range 3,488–118,649) and Y is the employment index (range 9,094–10,821, consistent with CES thousands-of-employees scale). This analysis proceeds on that basis.
1. Overall Relationship The scatterplot shows a strong, non-linear, saturating relationship: Y (professional/technical services employment) rises steeply as X (BTC price) increases from its low range (~3,500–20,000), then flattens into a high plateau (~10,750–10,820) once X exceeds roughly 40,000–50,000. This is not a straight-line relationship but rather a logarithmic or asymptotic curve — most of the "action" happens in the lower third of the X range, after which Y is nearly saturated.
2. Strength, Direction, and Predictive Power The linear correlation (r = 0.72, r² = 0.52) indicates a strong positive association, with the linear model explaining about 52% of Y's variance. However, given the visible curvature, this likely understates the true strength of a properly-specified non-linear (log or logistic) fit — a log-transform of X would probably yield a notably higher r². The 95% CI [0.62, 0.80] is reasonably tight and excludes zero, and the p-value (~0) confirms the correlation is statistically robust, not a chance artifact. Critically, though, Granger causality tests show no significant predictive direction either way (X→Y: p=0.61; Y→X: p=0.58). This means despite the strong contemporaneous association, neither series helps forecast the other's future values — the relationship is likely driven by both variables independently trending upward over the 2017–2026 window (e.g., both reflecting long-term economic/market growth) rather than one causing the other.
3. Notable Patterns and Outliers - Plateau clustering: A dense cluster of points sits at X 40,000 with Y pinned near 10,750–10,820, showing very low variance — employment growth has essentially topped out while BTC price continues climbing into six figures. - Steep-rise zone: Below X ≈ 25,000, Y is highly sensitive to X, ranging from ~9,090 to ~10,780 — small BTC price changes coincide with large employment shifts. - Transition outlier: (49,790, 9,710.40) is a notable exception — a high X value paired with a Y value far below the plateau, breaking the otherwise clean saturation pattern. This point deserves individual scrutiny (potential data error, lag effect, or genuine regime change). - Rounded "elbow": The bend around X ≈ 20,000–30,000 suggests a threshold or diminishing-returns effect rather than a continuous linear driver.
4. Confounding Factors and Caveats This is almost certainly a spurious or common-trend correlation. Both series are non-stationary time series that have trended upward over the 2017–2026 period (BTC due to market cycles/adoption; employment due to long-run economic and labor market growth, including post-pandemic recovery). Pairing daily crypto prices with monthly employment data (likely via forward-filling or resampling) introduces autocorrelation that inflates apparent correlation without implying any economic mechanism. There's no plausible direct causal channel connecting BTC price to broad professional-services staffing at this aggregation level. The lack of Granger causality strongly supports interpreting this as coincidental co-trending, not a functional relationship.
5. Recommendations - De-trend both series (e.g., first-differencing or detrending) before assessing correlation to check whether the relationship survives — if it collapses, this confirms spurious co-integration from shared time trends rather than genuine linkage. - Try a log/logistic fit on X to better capture the saturation curve and compare r² against the linear model. - Investigate the (49,790, 9,710) outlier for data quality issues or a real structural break. - Avoid using this pair for forecasting — the absence of Granger causality means neither series should be used as a leading indicator for the other despite the tempting r² value.
X dataset: CryptoDataDownload – Binance BTC/USDT Daily OHLCV
Y dataset: All Employees: Professional, Scientific, and Technical Services (CES6054000001)
Part of experiment: Bitcoin - CryptoDataDownload – Binance BTC/USDT Daily OHLCV vs All Employees: Professional, Scientific, and Technical Services (CES6054000001)