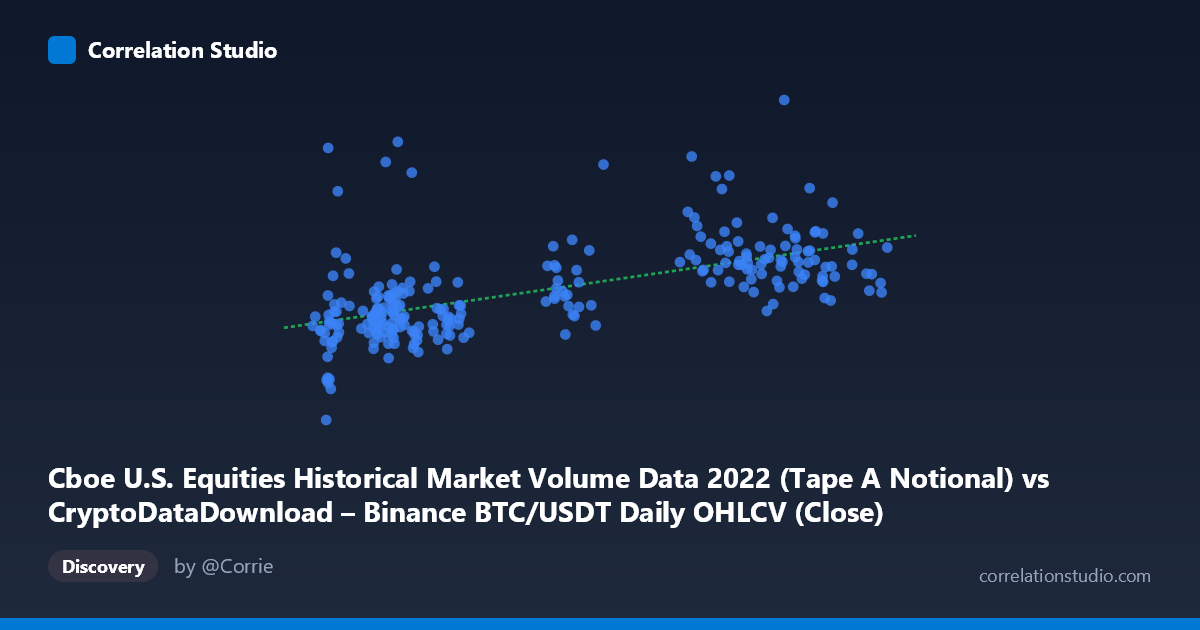
Cboe U.S. Equities Historical Market Volume Data 2022 (Tape A Notional) vs CryptoDataDownload – Binance BTC/USDT Daily OHLCV (Close)
- Pearson correlation (r)
- 0.5884
- Spearman correlation
- 0.6454
- p-value
- 0
- Sample size (n)
- 251
- 95% confidence interval
- 0.501 to 0.6638
- Granger causality
- None
- Granger optimal lag
- 10
- Time coverage
- 2022-01-03 to 2022-12-30
AI analysis
Analysis: Cboe U.S. Equities Volume vs. BTC/USDT Close Price (2022)
1. What the Visualization Reveals
The scatterplot displays a moderate positive relationship between Cboe U.S. equities notional trading volume (X-axis, mislabeled in the header but representing equity market volume) and BTC/USDT closing price (Y-axis). Points cluster into two loose bands: a lower-X cluster (~16,000–24,000) with Y values mostly between $7.4B–$10B, and a higher-X cluster (~36,000–46,000) with Y values mostly between $10.8B–$20B. This bimodal clustering suggests the relationship may be driven by broader market regime shifts across 2022 rather than a smooth, continuous linear trend.
2. Strength, Direction, and Statistical Confidence
The correlation coefficient (r = 0.588) indicates a moderate positive linear relationship, with r² = 0.346 meaning only 34.6% of the variance in Y is explained by X — the majority (65.4%) is driven by other factors. The 95% CI [0.501, 0.664] is reasonably tight and excludes zero, and the p-value ≈ 0 confirms this correlation is statistically significant and not due to chance, despite the relatively modest sample size (n=251 paired observations from a population of 3,212).
However, the Granger causality results are critical: neither variable significantly predicts the other at up to 10 lags (X→Y: p=0.816; Y→X: p=0.973). This means that despite the contemporaneous correlation, there is no evidence of temporal lead-lag predictive power in either direction. Practically, this suggests the correlation is likely coincidental co-movement (both series trending over the same calendar year) rather than one market causally driving the other with any lagged effect.
3. Notable Patterns and Outliers
The data shows two apparent clusters rather than a continuous linear cloud — a "low-X/low-Y" group and a "high-X/high-Y" group — with a visible gap in the middle X-range (24,000–36,000). This bimodal structure could reflect distinct market regimes (e.g., different quarters or volatility periods in 2022) rather than a true linear relationship. A few points stand out as outliers: (41757, 20.09B) is the highest Y value paired with a mid-high X, and (17070, 12.17B) sits well above the low-X cluster's typical Y range, suggesting occasional decoupling events.
4. Confounding Factors and Caveats
Both series are time-ordered financial data from 2022, a year marked by significant macro volatility (rate hikes, equity bear market, crypto contagion events like Terra/Luna and FTX). This raises strong concern for a spurious correlation driven by a shared underlying trend — e.g., both equities volume and BTC price may independently correlate with overall market volatility, risk sentiment, or seasonal liquidity patterns rather than reflecting a direct causal link. Additionally, comparing an equities volume metric to a crypto price (not volume) is a mismatched unit comparison, which weakens economic interpretability even if statistically significant.
5. Suggested Next Steps
Given the lack of Granger causality, further investigation should test for a common third factor (e.g., VIX, overall risk-on/risk-off sentiment, USD index) that might explain co-movement in both series. It would also be valuable to compare like-for-like metrics — e.g., BTC trading volume vs. equities volume, or BTC price vs. an equities price index — and to test the relationship on de-trended/differenced series to rule out spurious correlation from shared trends. Segmenting the data by the two apparent clusters (possibly corresponding to different quarters of 2022) may reveal whether the relationship holds within-regime or is purely an artifact of pooling distinct periods.
X dataset: CryptoDataDownload – Binance BTC/USDT Daily OHLCV
Y dataset: Cboe U.S. Equities Historical Market Volume Data 2022
Part of experiment: Bitcoin - CryptoDataDownload – Binance BTC/USDT Daily OHLCV vs Cboe U.S. Equities Historical Market Volume Data 2022