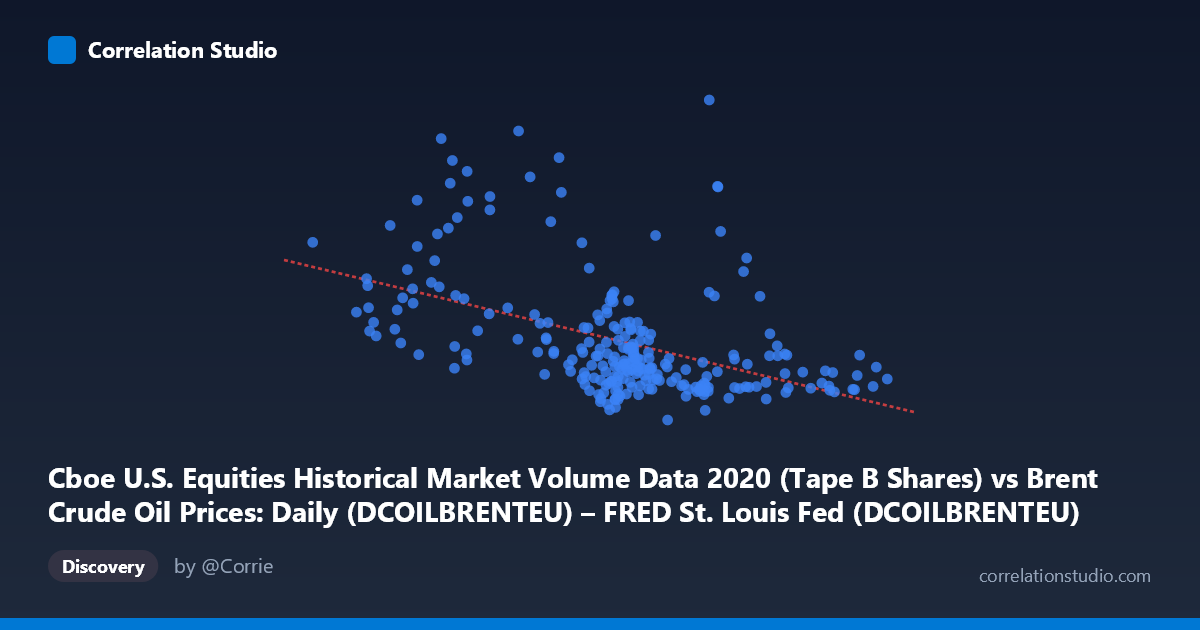
Cboe U.S. Equities Historical Market Volume Data 2020 (Tape B Shares) vs Brent Crude Oil Prices: Daily (DCOILBRENTEU) – FRED St. Louis Fed (DCOILBRENTEU)
- Pearson correlation (r)
- -0.4616
- Spearman correlation
- -0.4906
- p-value
- 0
- Sample size (n)
- 250
- 95% confidence interval
- -0.5539 to -0.358
- Granger causality
- None
- Granger optimal lag
- 10
AI analysis
Analysis: Brent Crude Oil Price vs. Cboe Tape B Equity Volume (2020)
Relationship Overview
The scatterplot reveals a moderate negative relationship between Brent Crude Oil prices (X-axis, USD/barrel) and Cboe Tape B equity share volume (Y-axis). The linear regression equation (y = -2,087,130x + 207,189,000) indicates that for each additional dollar per barrel in crude oil price, equity trading volume is predicted to decline by approximately 2.09 million shares. Visually, the data points form a downward-sloping cloud, consistent with the negative correlation, though with considerable dispersion around the regression line. The relationship is directionally intuitive — periods of lower crude prices (which characterized much of early-to-mid 2020 during the COVID-19 demand collapse) coincided with elevated, volatile equity trading volumes.
Correlation Strength and Statistical Significance
The Pearson correlation of r = -0.4616 indicates a moderate negative association, but the explanatory power deserves careful framing: R² = 0.2131 means only 21.3% of the variance in equity volume is explained by crude oil price, leaving nearly 79% attributable to other factors. The 95% confidence interval of [-0.5539, -0.3580] is entirely negative and does not cross zero, and the p-value of 1.354E-14 is extraordinarily small, making this correlation statistically unambiguous given the sample of n = 250 drawn from a population of N = 4,254 trading-day observations. However, statistical significance should not be conflated with practical or causal significance. Critically, the Granger causality tests show no significant predictive directionality in either direction — neither X→Y (F = 0.4736, p = 0.906) nor Y→X (F = 0.2786, p = 0.985) — meaning that past values of crude oil price do not help forecast equity volume, and vice versa. This substantially weakens any interpretation of a mechanistic or temporally structured relationship.
Notable Patterns, Clusters, and Outliers
Several features stand out in the data. The sample points reveal high vertical dispersion at moderate X values (roughly 40–45 USD/barrel), where Y ranges wildly from ~56 million to over 165 million shares — for instance, (40.71, 56,572,646) and (40.75, 157,241,412) are nearly identical in crude price yet differ by ~100 million in volume. This suggests the relationship is far from deterministic in that price range. At low crude prices (below ~25 USD/barrel), there are several high-volume outliers — (17.36, 226,292,937) and (14.85, 177,318,011) — consistent with the March–April 2020 crude oil price crash coinciding with peak pandemic-driven market panic and record equity trading volumes. At the high end of crude prices (60–70 USD/barrel), volume consistently clusters low, around 70–90 million shares, with less dispersion. One notable outlier is (35.33, 288,680,212), which sits dramatically above the regression line and likely reflects an extreme volatility event rather than a structural feature of the relationship.
Confounding Factors and Caveats
The 2020 time period is a critical caveat — this was a historically anomalous year dominated by the COVID-19 pandemic, which simultaneously caused crude oil prices to collapse (including the unprecedented negative WTI price event in April 2020) and triggered record equity market volatility and retail trading surges. Both variables were likely driven by a common third factor: pandemic-related macroeconomic shock, rather than one causing the other. This classic confounding scenario means the observed correlation may be largely spurious, reflecting synchronized responses to an external catalyst rather than any structural financial linkage between crude benchmarks and Tape B equity volume specifically. Additionally, Tape B covers regional exchanges (e.g., NYSE American, NYSE Arca), which may respond differently to macro conditions than broader market indices, adding noise. The optimal Granger lag of 10 periods (approximately two trading weeks) yielding non-significant results further underscores that this is not a leading/lagging relationship.
Actionable Insights and Further Investigation
Given the moderate but statistically robust correlation alongside the absence of Granger causality, the most productive next steps would be: (1) Decompose the time series into pre-COVID, crash, and recovery phases to test whether the correlation is regime-dependent or concentrated in the March–April 2020 shock period; (2) introduce a volatility index (VIX) as a control variable, since it likely mediates or confounds both crude prices and equity volumes simultaneously; (3) examine whether the relationship holds in non-crisis years (2018–2019, 2021–2023) to assess whether 2020 is an outlier year structurally; and (4) investigate the specific outlier at (35.33, 288,680,212) to identify the precise date and event driving that observation. For practitioners, the takeaway is clear: crude oil price alone is a weak and temporally non-predictive signal for Tape B equity volume, and reliance on this relationship for trading or risk models — especially outside crisis conditions — would be inadvisable without substantially richer multivariate modeling.
X dataset: Brent Crude Oil Prices: Daily (DCOILBRENTEU) – FRED St. Louis Fed
Y dataset: Cboe U.S. Equities Historical Market Volume Data 2020
Part of experiment: Daily - Brent Crude Oil Prices: Daily (DCOILBRENTEU) – FRED St. Louis Fed vs Cboe U.S. Equities Historical Market Volume Data 2020