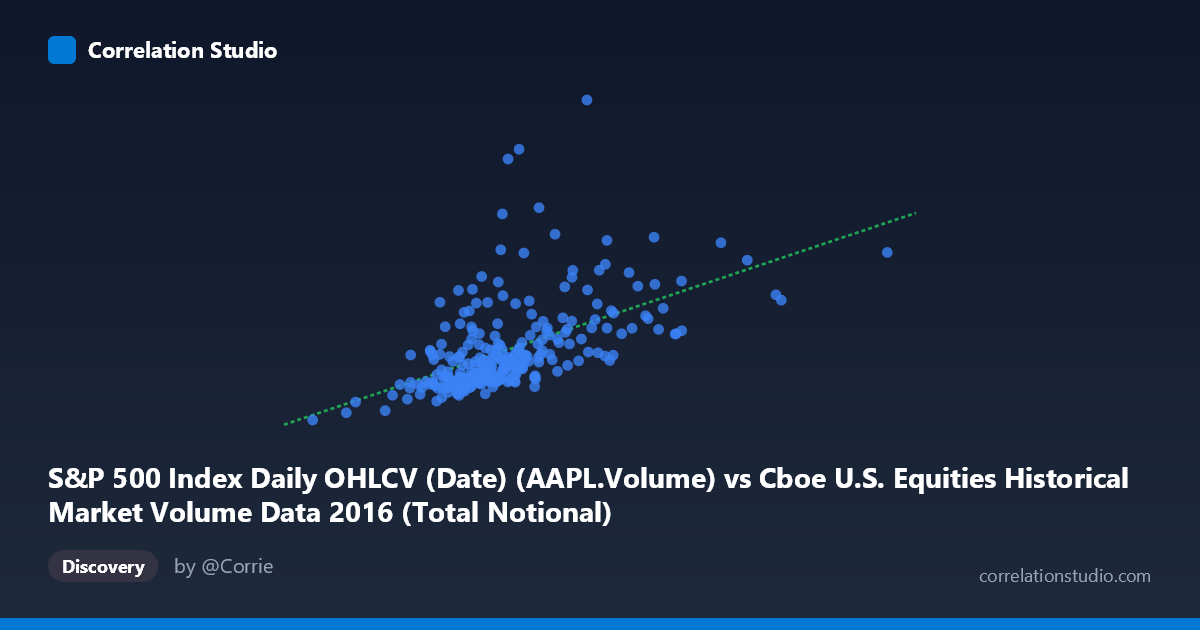
S&P 500 Index Daily OHLCV (Date) (AAPL.Volume) vs Cboe U.S. Equities Historical Market Volume Data 2016 (Total Notional)
- Pearson correlation (r)
- 0.5476
- Spearman correlation
- 0.6305
- p-value
- 0
- Sample size (n)
- 252
- 95% confidence interval
- 0.4548 to 0.6286
- Granger causality
- None
- Granger optimal lag
- 10
AI analysis
Scatterplot Analysis: AAPL Trading Volume vs. Cboe Total Notional Value (2016)
Relationship Overview The scatterplot reveals a moderate positive relationship between Apple Inc.'s daily trading volume on the S&P 500 (X-axis) and the total notional value of U.S. equities traded across Cboe markets (Y-axis) throughout 2016. As AAPL volume increases, total market notional value tends to rise as well, which is intuitive given that AAPL is one of the most heavily traded and highest-capitalization stocks in the U.S. equity market. However, the relationship is far from deterministic, with considerable vertical scatter visible across the full range of AAPL volume values, suggesting that many trading days with similar AAPL volumes produce substantially different total notional outcomes.
Correlation Strength and Statistical Framing The Pearson correlation of r = 0.548 indicates a moderate positive association, but the explained variance tells a more sobering story: R² = 0.30, meaning AAPL volume accounts for only 30% of the variance in total Cboe notional value, leaving 70% unexplained by this single predictor. The 95% confidence interval of [0.455, 0.629] is reasonably tight and does not approach zero, and the p-value of effectively 0 confirms this relationship is highly statistically significant across the 252 paired observations. That said, statistical significance here is partly a function of sample size — practical significance is more modestly characterized by that 30% explained variance. Critically, the Granger causality tests are non-significant in both directions (X→Y: F = 1.41, p = 0.18; Y→X: F = 1.20, p = 0.29), meaning that neither variable reliably predicts the other in a time-lagged sense at the optimal 10-period lag. This rules out straightforward temporal predictive utility and cautions against any causal interpretation.
Notable Patterns, Clusters, and Outliers The bulk of observations cluster in a relatively compact core region — AAPL volumes between roughly 14–22 billion and notional values between 20–60 million — consistent with the mean and standard deviation statistics provided. However, there are several prominent high-leverage outliers that demand attention: at least two data points show notional values exceeding 90–133 million (the maximum being 133,369,700), while their corresponding AAPL volumes are not exceptional, sitting near the mean. The point at approximately (23.5B, 133.4M) is particularly striking and may correspond to a specific high-volatility market event in 2016 (e.g., Brexit vote aftermath, U.S. election day). Similarly, a cluster of points with elevated Y values but mid-range X values suggests that total market notional can spike dramatically due to broad market forces that are only loosely tethered to AAPL-specific volume. The regression line (y = 0.002198x − 3.37M) appears to underfit these high-notional outliers, hinting at heteroscedasticity — variance in Y increases at higher X values.
Confounding Factors and Interpretive Caveats Several important caveats apply. First, there is a dataset labeling asymmetry worth flagging: the X variable is described as AAPL volume from the Cboe dataset, while the Y variable is total notional from the S&P 500 OHLCV dataset — this cross-dataset pairing may introduce alignment or definitional inconsistencies. Second, both variables are likely driven by common underlying market factors such as macroeconomic announcements, Federal Reserve decisions, index rebalancing events, or geopolitical shocks (2016 was unusually event-rich), making the correlation partially spurious — they co-move because the same external forces drive both, not because one causes the other. Third, AAPL's market cap weight in major indices means it is not independent of broad market activity, creating circularity. Finally, the absence of Granger causality at a 10-period lag does not rule out instantaneous or very short-term co-movement within the trading day.
Actionable Insights and Further Investigation Given that 70% of variance remains unexplained, a natural next step would be to build a multivariate model incorporating additional volume metrics (e.g., other mega-cap stocks like MSFT, AMZN, GOOGL), VIX levels, or sector rotation indicators to better explain total notional variation. Investigators should isolate and examine the extreme outlier days — particularly the ~133M notional observation — to determine whether they represent genuine structural events or data anomalies, as their influence on the regression slope and correlation could be material. It would also be valuable to segment the analysis by market regime (e.g., pre- vs. post-election, high vs. low VIX periods) to test whether the correlation is stable or event-driven. Finally, testing shorter Granger lags (1–3 periods) may reveal intraweek predictive dynamics not captured at the 10-period optimal lag identified here.
X dataset: Cboe U.S. Equities Historical Market Volume Data 2016
Y dataset: S&P 500 Index Daily OHLCV (Date)
Part of experiment: Daily - Cboe U.S. Equities Historical Market Volume Data 2016 vs S&P 500 Index Daily OHLCV (Date)