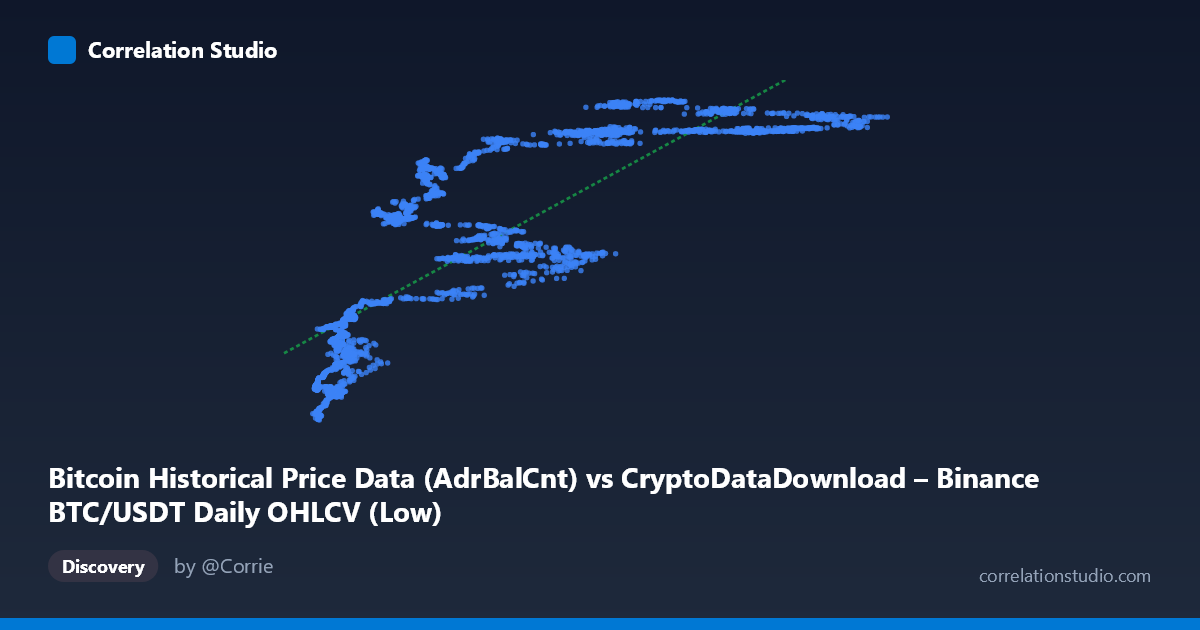
Bitcoin Historical Price Data (AdrBalCnt) vs CryptoDataDownload – Binance BTC/USDT Daily OHLCV (Low)
- Pearson correlation (r)
- 0.8293
- Spearman correlation
- 0.9003
- p-value
- 0
- Sample size (n)
- 3191
- 95% confidence interval
- 0.8181 to 0.8398
- Granger causality
- None
- Granger optimal lag
- 10
AI analysis
Analysis: Bitcoin Address Count vs. BTC/USDT Price
1. What the Visualization Reveals
The scatterplot depicts a positive, moderately strong relationship between Bitcoin's Active Address Count (X) and its daily Low price on Binance (Y). As the number of active addresses increases from roughly 2,800 to 123,000, the price generally rises from the $19M–$28M range toward $53M–$57M range. The data forms a broadly upward-sloping band rather than a tight line, with visible curvature suggesting the relationship isn't perfectly linear across the full domain.
2. Strength, Direction, and Predictive Relationship
The correlation coefficient (r = 0.829) indicates a strong positive linear association, and r² = 0.688 tells us that roughly 69% of the variance in price is statistically explained by variance in address count — leaving about 31% driven by other factors. The 95% CI [0.818, 0.840] is tight, and the p-value of 0 confirms this correlation is highly statistically significant and not due to chance, given the large sample (n=3,191).
However, the Granger causality results temper any causal interpretation: neither direction shows significant predictive power (X→Y: p=0.150; Y→X: p=0.054, both above the 0.05 threshold, though Y→X is close). This means neither historical address counts nor historical prices reliably help forecast future values of the other variable at the tested lag structure. The strong contemporaneous correlation likely reflects both variables responding to shared underlying market cycles rather than one driving the other in a time-lagged sense.
3. Notable Patterns and Non-Linear Features
Several clusters are apparent in the sample data: - Low-price/low-address cluster: Points below X=15,000 cluster tightly around Y=19M–33M, showing lower variance. - Mid-range plateau: Between X≈50,000–70,000, Y values cluster heavily around 51M–57M, suggesting price may plateau or saturate even as address count continues rising — a sign of diminishing marginal relationship (logarithmic rather than linear growth). - High-X scatter: At X75,000, prices remain in a similar 53M–57M band, reinforcing the flattening pattern at the upper end.
This suggests the true relationship may be better modeled as logarithmic or power-law (common in network-value relationships like Metcalfe's Law applications to crypto), rather than the strictly linear model shown (y = 310.74x + 27.74M).
4. Confounding Factors and Caveats
Both variables are likely driven by common macro factors — market sentiment, adoption cycles, regulatory news, and overall crypto market conditions — creating a classic case of spurious or indirect correlation rather than direct causation. Additionally: - Both series are time-series with trends, meaning autocorrelation could inflate the apparent correlation (a well-known issue when both variables trend upward over the same multi-year period, 2017–2026). - Address count can be influenced by exchange batching, wallet reuse patterns, or network congestion — not purely organic user growth. - The "Low" price metric is influenced by daily volatility and market microstructure, unrelated to on-chain fundamentals.
5. Actionable Insights and Further Investigation
- De-trend both series (e.g., first-difference or log-difference) before re-running correlation and Granger tests to control for shared trend and check if a genuine leading/lagging relationship emerges. - Test non-linear models (log-log or power-law fits) given the apparent saturation pattern at high address counts. - Segment by market regime (bull vs. bear cycles) to see if the relationship strength varies by phase — strong bull markets may show tighter coupling than consolidation periods. - Given the lack of Granger causality, this relationship is best used as a descriptive/contemporaneous indicator (e.g., for sanity-checking valuation models) rather than a forecasting tool for price prediction based on address growth.
X dataset: CryptoDataDownload – Binance BTC/USDT Daily OHLCV
Y dataset: Bitcoin Historical Price Data
Part of experiment: Bitcoin - CryptoDataDownload – Binance BTC/USDT Daily OHLCV vs Bitcoin Historical Price Data