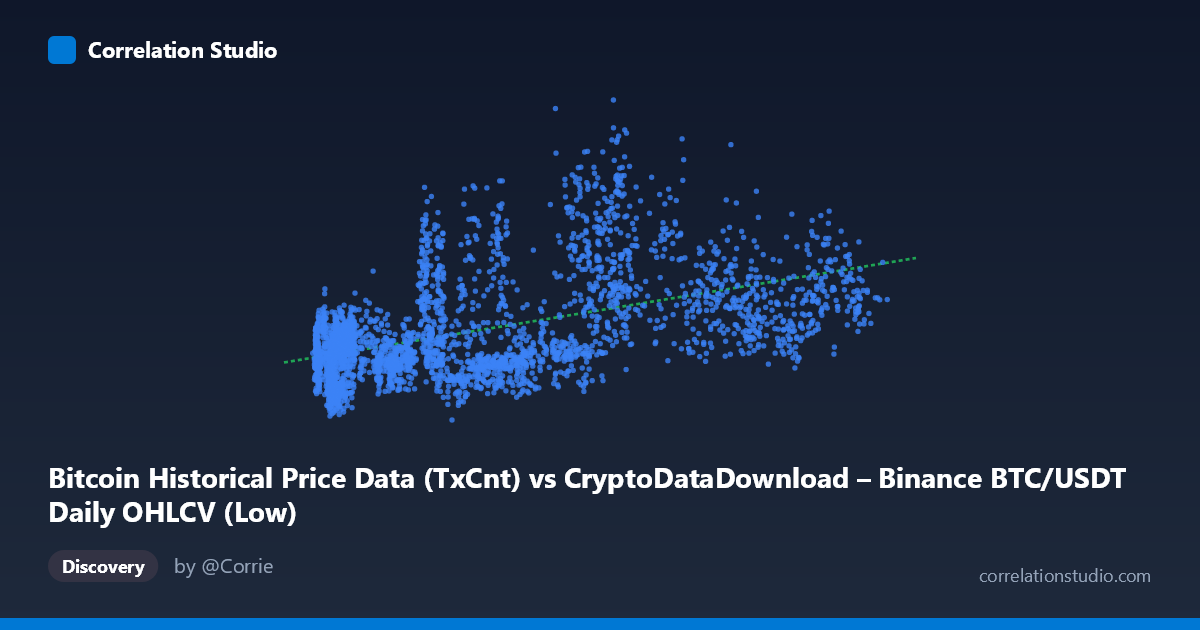
Bitcoin Historical Price Data (TxCnt) vs CryptoDataDownload – Binance BTC/USDT Daily OHLCV (Low)
- Pearson correlation (r)
- 0.5052
- Spearman correlation
- 0.507
- p-value
- 0
- Sample size (n)
- 3191
- 95% confidence interval
- 0.4789 to 0.5306
- Granger causality
- None
- Granger optimal lag
- 10
- Time coverage
- 2017-08-17 to 2026-05-20
AI analysis
Analysis: Bitcoin Transaction Count vs. Price (Low)
1. Relationship Overview
The scatterplot depicts a positive but noisy association between Bitcoin's daily transaction count (X) and the daily low price (Y). While there is a discernible upward tendency — higher transaction counts loosely correspond to higher price lows — the relationship is far from tight or deterministic. The data cloud is wide and diffuse rather than forming a clean linear band, indicating that transaction count is only one of many factors influencing price level.
2. Strength, Direction, and Statistical Confidence
The correlation coefficient (r = 0.505) indicates a moderate positive relationship, and r² = 0.255 tells us that only about 25.5% of the variance in price lows is explained by transaction count — leaving nearly three-quarters of price variation attributable to other factors (macro sentiment, liquidity, halving cycles, regulatory news, etc.). The 95% confidence interval [0.479, 0.531] is fairly narrow given the large sample (n = 3,191), and the p-value of ~0 confirms this correlation is highly statistically significant — it is very unlikely to be due to chance. However, statistical significance here reflects the large sample size more than practical predictive strength; a moderate r with high significance means the relationship is real but weak in practical utility.
Critically, the Granger causality tests show no significant predictive direction in either direction (X→Y: p = 0.592; Y→X: p = 0.889) at the optimal lag of 10 periods. This means neither transaction count nor price reliably leads the other in a temporal, forecasting sense. The two series may move together (contemporaneously correlated) due to shared external drivers, but neither can be used to systematically predict future values of the other based on lagged history alone.
3. Patterns, Clusters, and Outliers
Several notable features emerge from the sample points: - Heavy left-skew in X: Many observations cluster at low transaction counts (under 20,000), while high-X observations (80,000) are comparatively sparse — consistent with the large gap between the X mean (36,727) and its stdev (31,924), suggesting a right-skewed distribution with a long tail toward high transaction counts. - Vertical scatter at low X: At low transaction counts, Y ranges enormously (e.g., from ~134,000 to ~724,000), suggesting that during certain periods (likely bear/consolidation phases with low on-chain activity) prices can still sit at very different levels — likely reflecting different market eras/cycles rather than a stable X-Y relationship within any single period. - No clear non-linear curve: The linear fit (y = 1.985x + 274,873) doesn't show obvious signs that a log or power curve would fit dramatically better, though the wide vertical spread at low X hints at heteroscedasticity (non-constant variance).
4. Confounding Factors and Caveats
The most important caveat is time itself as a lurking confounder. This spans 2017–2026, covering multiple bull/bear cycles, halvings, and dramatically different market structures (e.g., 2017 ICO boom, 2020–21 bull run, 2022 bear market). Both transaction count and price are likely driven by common macro factors — adoption trends, speculative cycles, liquidity conditions — rather than one causing the other. Additionally, "Y" is sourced from a different dataset than "X" despite both nominally being BTC/USDT OHLCV data, raising questions about label consistency (X is described as "TxCnt" but attributed to an OHLCV dataset), which may indicate a data-labeling or merge artifact worth double-checking.
5. Suggested Next Steps
- De-trend or difference both series (e.g., use returns/percentage changes instead of levels) before correlating, to remove the shared upward "cycle" trend and isolate genuine short-term co-movement. - Segment by market regime/year to check if the r² is driven by a handful of cycles rather than a consistent relationship. - Verify data provenance for the X column, since its label ("TxCnt") conflicts with its stated source dataset (OHLCV) — this mismatch could be inflating or distorting the correlation. - Given the null Granger result, avoid using transaction count as a leading indicator for price in trading models; instead, treat both as coincident indicators possibly driven by shared latent market conditions. - Consider adding a third variable (e.g., trading volume, active addresses, or macro liquidity indices) to a multivariate model, since transaction count alone explains only a quarter of price variance.
X dataset: CryptoDataDownload – Binance BTC/USDT Daily OHLCV
Y dataset: Bitcoin Historical Price Data
Part of experiment: Bitcoin - CryptoDataDownload – Binance BTC/USDT Daily OHLCV vs Bitcoin Historical Price Data